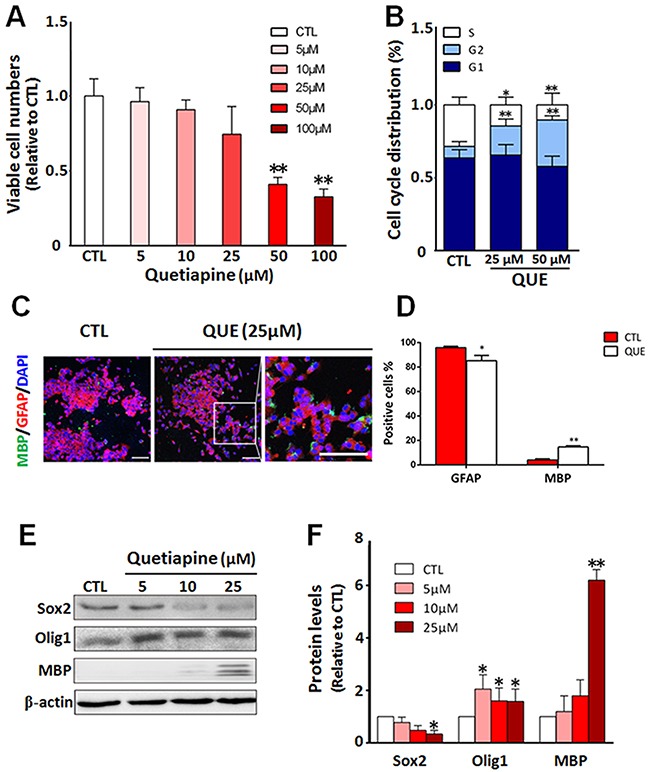
Figure 1. QUE inhibits proliferation but promotes differentiation of GSCs into oligodendrocyte-like cells in vitro.

(A) Cell counting assessment showing viable cell numbers after in vitro treatment of QUE (5 ~ 100μm) vs controls (CTL). (B) Cytometry assay showing changes in cell cycle status of GSCs after QUE treatments. (C) Representative immunofluorescence staining showing cellular changes of lineage cell markers after QUE treatment: GFAP (red), MBP (green) and nuclei marker DAPI (blue). Scale bar: 100μm. (D) Quantitative analysis of GFAP and MBP positive cells after QUE treatment. (E) Representative Western blot revealing the expression levels of GSC marker (Sox2) and oligodendroglia lineage markers (Olig1, MBP) in cells with treatments of QUE (5, 10, 25μM) vs controls (CTL). (F) Quantification of protein levels of Sox2, Olig1 and MBP from GSCs after treatment of QUE (5, 10, 25 μM) vs controls (CTL). Data were from three independent experiments. *P <0.05, **P<0.01 vs CTL.
