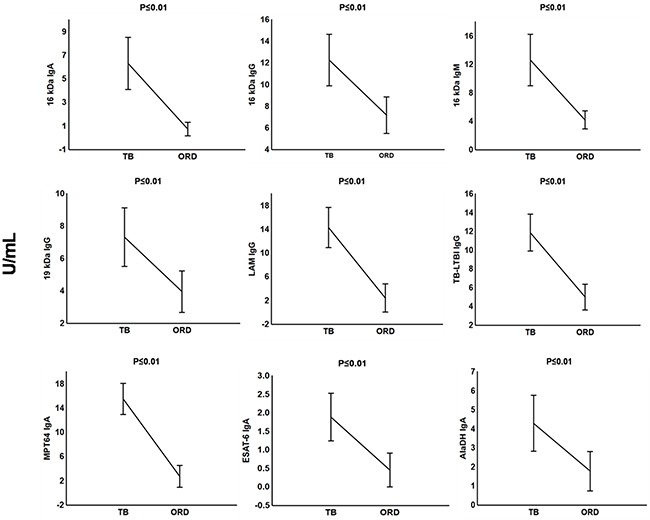
Figure 1. Plasma concentrations of serodiagnostic markers in TB and ORD.

Concentrations of plasma serodiagnostic markers were measured in 21 TB patients, and 42 ORD cases. The ORD group comprised 21 LTBI individuals and 21 QFT-negative ORD. Representative plots are shown for diagnostic markers showing significant differences between groups and the vertical bars denote the mean and 95% confidence intervals. Corrections were applied within analyses of markers using Fischer Least Significant Differences post hoc test or Games- Howell post hoc test depending on homogeneity of variance. All the reported significant p-values were adjusted.
