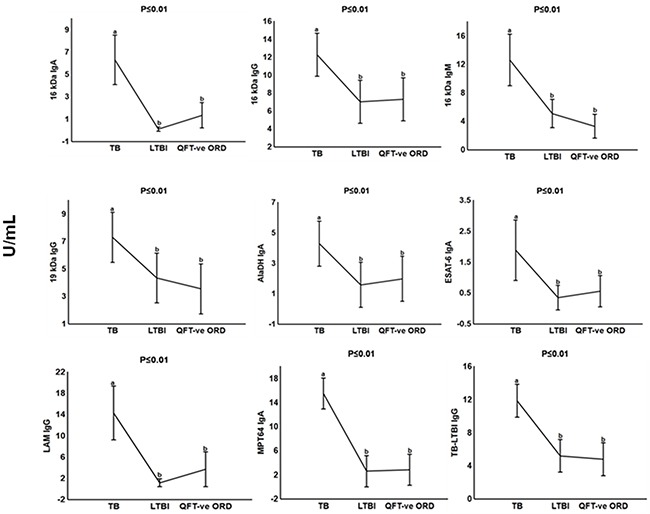
Figure 3. Plasma concentrations of serodiagnostic markers in individuals with tuberculosis, latently infected tuberculosis and QFT-negative other respiratory diseases.

Concentrations of plasma serodiagnostic markers were measured in 21 tuberculosis patients, 21 latently infected tuberculosis individuals and 21 QFT-negative other respiratory diseases. Representative plots are shown for diagnostic markers showing significant differences between groups and the vertical bars denote 95% confidence intervals. Significant difference between different groups p<0.05 is shown with the different alphabetical letters. The same alphabetical letters are used when there is no significant difference p>0.05 between the different groups. Corrections were applied within analyses of markers using Fischer Least Significant Differences post hoc testing or Games Howell post hoc depending on homogeneity of variance. All the reported significant p-values were adjusted.
