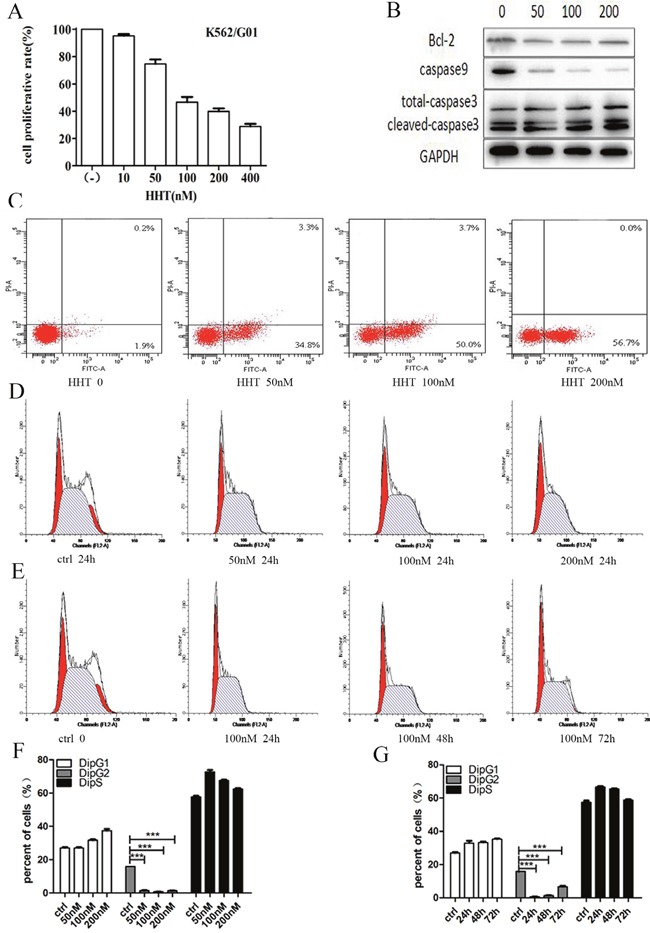
Figure 4. Cell growth inhibition, apoptosis and cell cycle arrest of HHT in K562/G01 cells.

(A) K562/G01 cells were treated with HHT at the indicated concentrations for 24 hours. The concentrations were 0, 10, 50, 100, 200, 400 nM. (B) The expression of apoptosis proteins. K562/G01 cells treated with HHT 0, 50nM, 100 nM, 200nM for 24h. Bcl-2, caspase9, caspase3 express. (C) Apoptosis of K562/G01 cells. K562/G01 cells treated with HHT 0, 50nM, 100 nM, 200nM for 24h. (D) Cycle of K562/G01 cells. K562/G01 cells treated with HHT 0, 50nM, 100 nM, 200nM for 24h. (E) Cycle of K562/G01 cells. K562/G01 cells treated with 100 nM HHT for 24h, 48h, 72h. (F) Cycle of K562/G01 cells. K562/G01 cells treated with HHT 0, 50nM, 100 nM, 200nM for 24h. (G) Cycle of K562/G01 cells. K562/G01 cells treated with 100 nM HHT for 24h, 48h, 72h. Cell viability was determined by CCK-8. The expression of proteins were determined by western blot. PE annexin V detect apoptosis. Flow cytometry detect cycle. Values shown are mean ± SD. Of three independent experiments.
