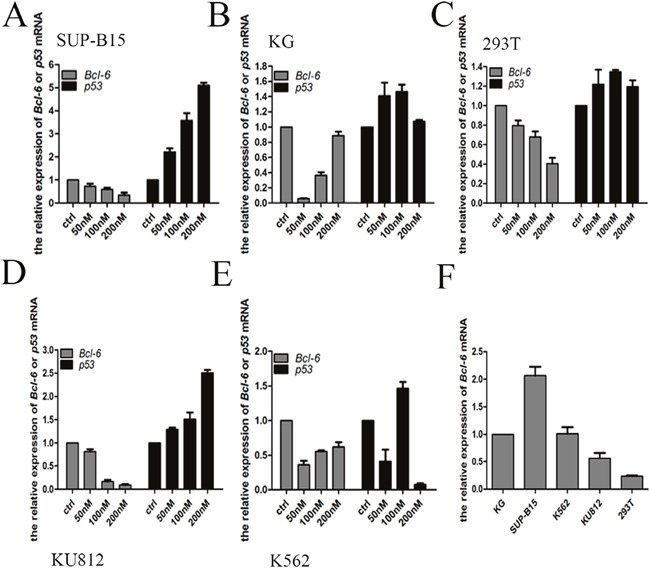
Figure 7. HHT effect the Bcl-6 and p53 mRNA expression.

(A) SUP-B15 cells were treated with HHT 0, 50nM, 100 nM, 200nM for 24h. (B) K562/G01 cells were treated with HHT 0, 50nM, 100 nM, 200nM for 24h. (C) 293T cells were treated with HHT 0, 50nM, 100 nM, 200nM for 24h. (D) KU812 cells were treated with HHT 0, 50nM, 100 nM, 200nM for 24h. (E) K562 cells were treated with HHT 0, 50nM, 100 nM, 200nM for 24h. (F) The Bcl-6 expression of 5 cells without treatment. The expression of mRNA were determined by qRT-PCR. Values shown are mean ± SD. Of three independent experiments.
