
Figure 3. miR-5096 decreases KCNJ10 gene expression in U87 and U251 glioblastoma cells.
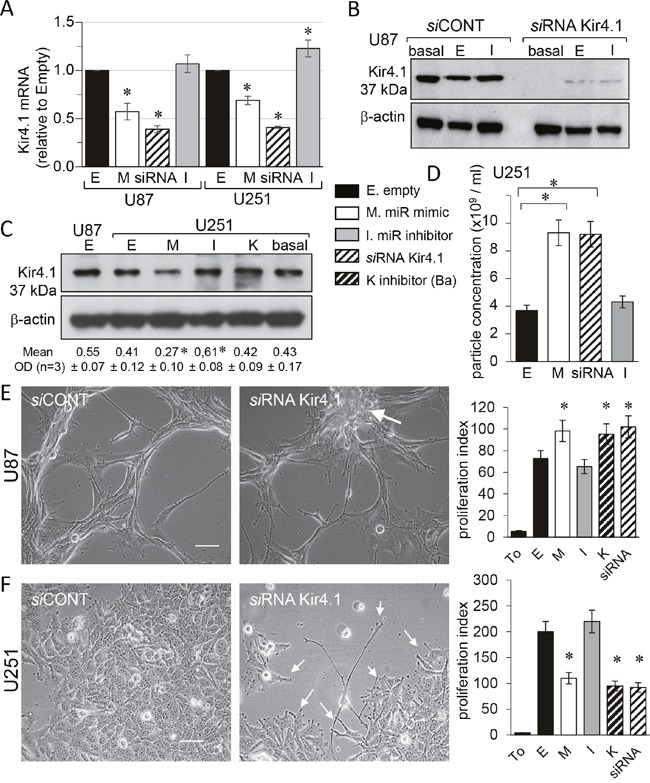
Homotypic cell cultures were loaded or not (empty, E; or basal level) with miR-5096 mimic (M) or inhibitor (I; 30 nM), transfected by Kir4.1 siRNA (siRNA) or exposed to 500 μM BaCl2 (K). (A) Cell loading miR-5096 decreased Kir4.1 mRNA expression in both U87 and U251 cells. Data are normalized values to GAPDH, expressed relative to the levels in Empty conditions and are mean ±SD (each measurement was made in triplicate; n=4; *P-values<0.05 vs empty). (B) Representative western blot of Kir4.1 protein level in U87 cells transfected with control or Kir4.1 siRNA for 2 days (n=5; Hsc70 as loading control). (C) Immunoblot analysis of Kir4.1 protein in whole cell lysates from U251 cells. One representative of 3 independent experiments is shown (β-actin as loading control). Numbers indicated mean values of relative optical density (OD) of bands (± SD; *P<0.05 vs basal; n = 3). (D) Loading miR-5096 mimic (M) or silencing Kir4.1 (siRNA), both increased the release of exosomes by U251 (mean ± SD; P>0.05 vs empty for each group; n = 3). (E) Kir4.1 siRNA transfection increased the proliferation of U87, as did miR5096 mimic. Images of cells showing finger-like projections (filopodia) and the cell growth in a “rosary” induced by silencing Kir4.1 expression (white arrow; scale bar, 50 μm). Right histogram: 48 h after transfection, cells were tested for additional 24 h of culture for tracking proliferation (T0, initial time point of experiment; mean ± SD; *P<0.05 vs empty; n = 3). (F) Kir4.1 siRNA transfection decreased the proliferation of U251 as did miR5096 mimic. Same protocols as in (E) While U251 cells proliferate in cobblestone monolayer in control conditions, they slow down their growth and emit finger-like projections (filopodia; white arrows) by silencing Kir4.1 expression.