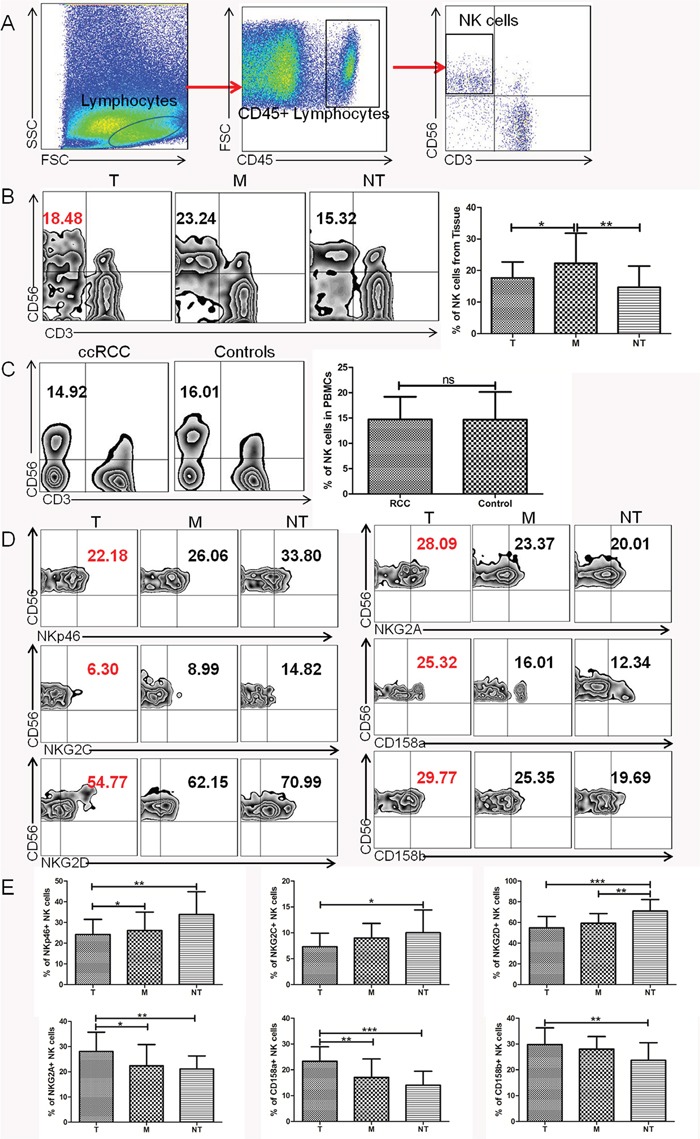
Figure 1. TINK cells in RCC display an abnormal phenotype.

(A) Lymphocyte gate of freshly purified mononuclear cells (MNCs) and NK cells. (B) Percentage of NK cells from tumor tissue (T, n = 36), tumor margin tissue (M, n = 36), and non-tumor tissue (NT, n = 16, mean±sd). (C) Percentage of NK cells in PBMCs from ccRCC patients (ccRCC, n = 36) and healthy individuals (HC, n = 36, mean±sd). (D) The percentage of NK-cell activation receptors NKp46, NKG2D, NKG2C and inhibitory receptors NKG2A, CD158a, CD158b expressed on NK cells from tumor tissue (T, n = 36), tumor margin tissue (M, n = 36), and non-tumor tissue (NT, n = 16, mean±sd). (E) Pooled percentage of NK receptors expressed on NK cells from tumor tissue, tumor margin tissue, and non-tumor tissue (T, n = 36; M, n = 36; NT, n = 16, mean±sd), *p < 0.05, **p < 0.01 and ***p < 0.001vs corresponding control.
