
Figure 1. Kaplan-Meier analyses for TTP in TACE patients.
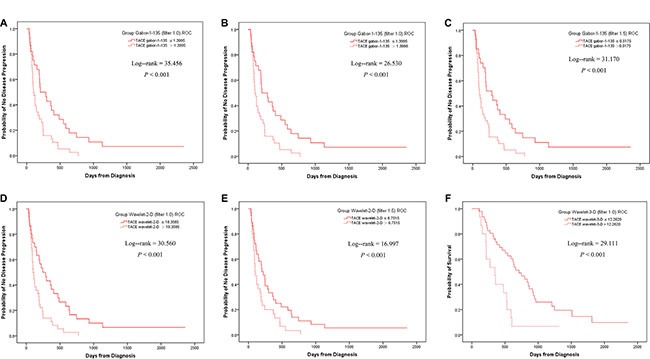
When separated by the ROC threshold of Gabor-1–90 at filter 0, the two subgroups had a statistical difference in TTP (A). Similar results could be achieved by the threshold of Gabor-1-135 at filter 1.0 (B), Gabor-1-135 at filter 1.5 (C) wavelet-2-D at filter 1.0 (D) and wavelet-2-D at filter 1.5 (E). When separated by the threshold of wavelet-3-D at filter 1.0, the two subgroups had a statistical difference in OS (F).