Figure 4.
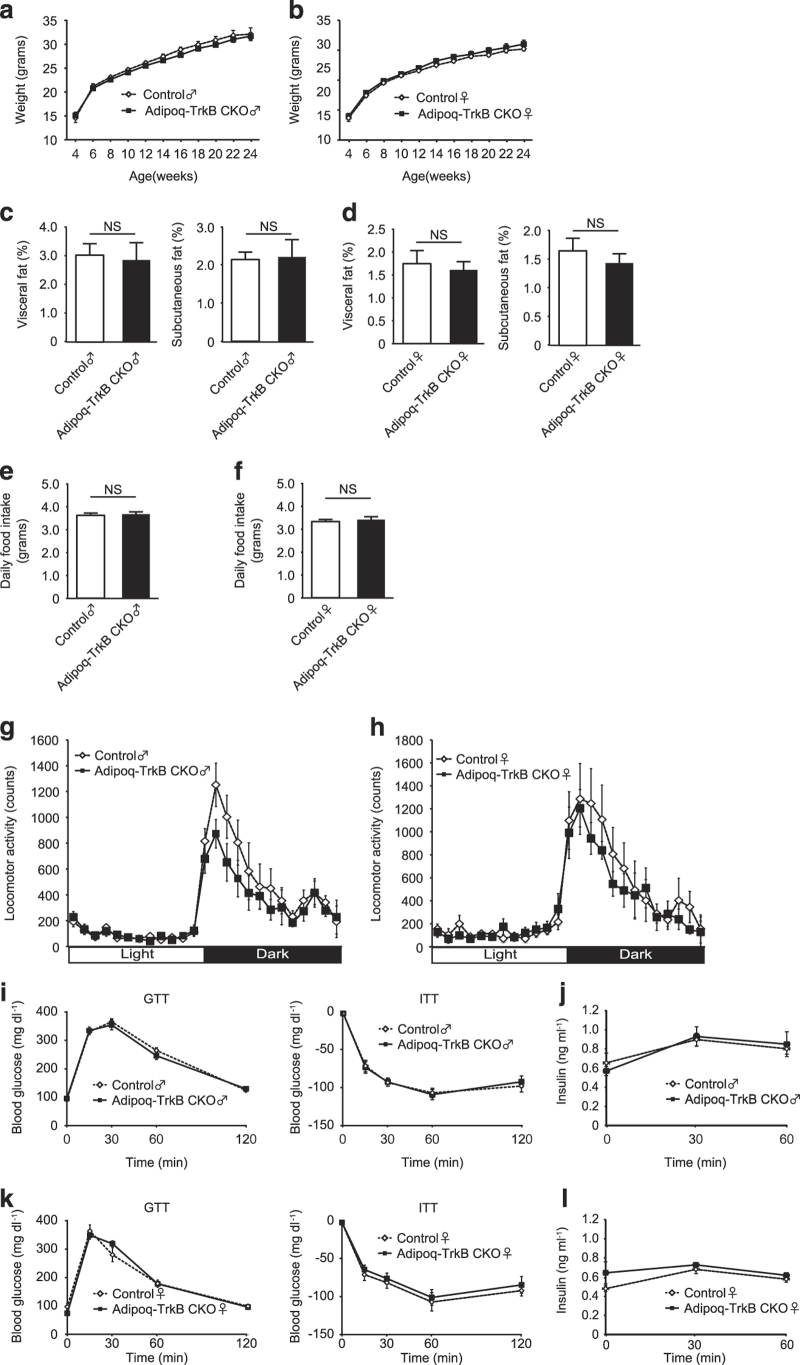
Adipocyte-specific deletion of Ntrk2 does not cause obesity. (a and b) Body weight of Adipoq-TrkB CKO male mice (a) and female mice (b) receiving a normal diet compared with their littermate controls (Control); n=11–12 for a, n=10–11 for b. (c and d) CT analysis of Adipoq-TrkB CKO male mice (c) and female mice (d) receiving a normal diet compared with their littermate controls (Control) at 12–14 weeks of age. The percent fat tissue/body weight ratio is shown for visceral fat and subcutaneous fat; n=6 for c, n=9–10 for d. (e and f) Food intake of Adipoq-TrkB CKO male mice (e) and female mice (f) receiving a normal diet compared with their littermate controls (Control) at 8–12 weeks of age; n=9–10 for e, n=9–10 for f. (g and h) Locomotor activity of Adipoq-TrkB CKO male mice (g) and female mice (h) receiving a normal diet compared with their littermate controls (Control) at 14–16 weeks of age; n=6 for g, n=6 for h. (i) Glucose tolerance test (GTT) and insulin tolerance test (ITT) in Adipoq-TrkB CKO male mice receiving a normal diet compared with their littermate controls (Control) at 12–14 weeks of age; n=9–13 for GTT, n=10–13 for ITT. (j) Plasma insulin level during the GTT shown in Figure 5i; n=9–10. (k) GTT and ITT in Adipoq-TrkB CKO female mice receiving a normal diet compared with their littermate controls (Control) at 12–14 weeks of age; n=15–16 for GTT, n=7–10 for ITT. (l) Plasma insulin level during the GTT shown in Figure 5k; n=7–10. Data are shown as the mean±s.e.m. CKO, conditional knockout.

