Figure 1.
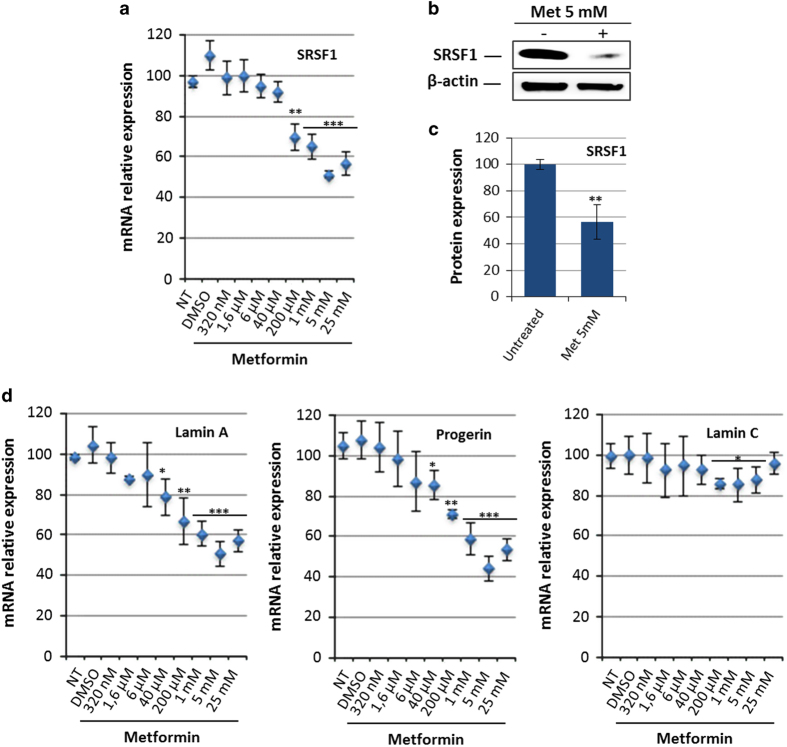
Metformin regulates SRSF1 expression in HGPS MSCs. (a) Quantitative PCR analysis of SRSF1 expression in HGPS MSCs treated for 48 h with increasing doses of metformin. Each percentage value represents the mean±s.d. for eight replicates. (b) Western blot analysis of SRSF1 expression in HGPS MSCs treated for 48 h with 5 mmol/l (mM) metformin. β-Actin served as a loading control. (c) Densitometry measurement of protein levels was relative to untreated cells. The data are presented as mean±s.d. (n=3). (d) Quantitative PCR analysis of lamin A, progerin and lamin C expression in HGPS MSCs treated with increasing doses of metformin. Each value represents the mean±s.d. of the percentage of eight replicates. Statistical analysis was performed by one-way analysis of variance (ANOVA), using Dunnett’s comparison test. Values of P<0.05 were considered significant (*P<0.05, **P<0.01, ***P<0.001). HGPS, Hutchinson–Gilford progeria syndrome; MSC, mesenchymal stem cell; mRNA, messenger RNA.

