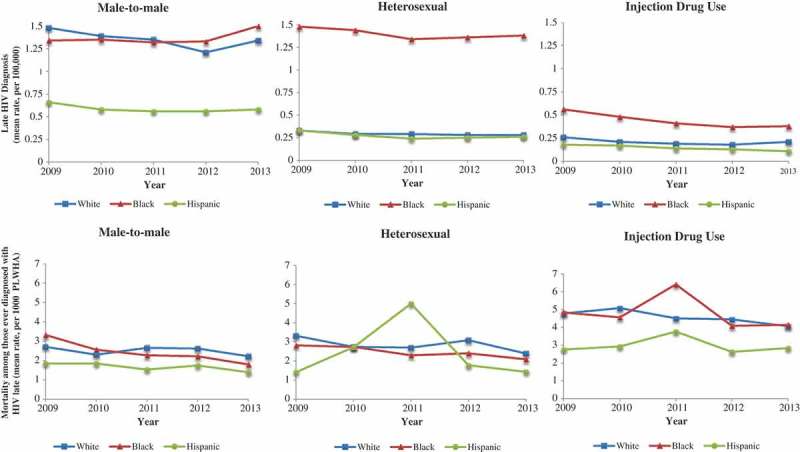
Figure 2.

Five-year trends of late HIV diagnosis across race/ethnicity by transmission group (graphs on top) and all-cause mortality among people ever diagnosed with HIV late (bottom).
We calculated rates based on data from 47 American states (Alaska and Hawaii, and New Hampshire were excluded due to missing or suppressed social trust or HIV/AIDS data; Washington D.C. for extremely high outlier values on HIV/AIDS data).
