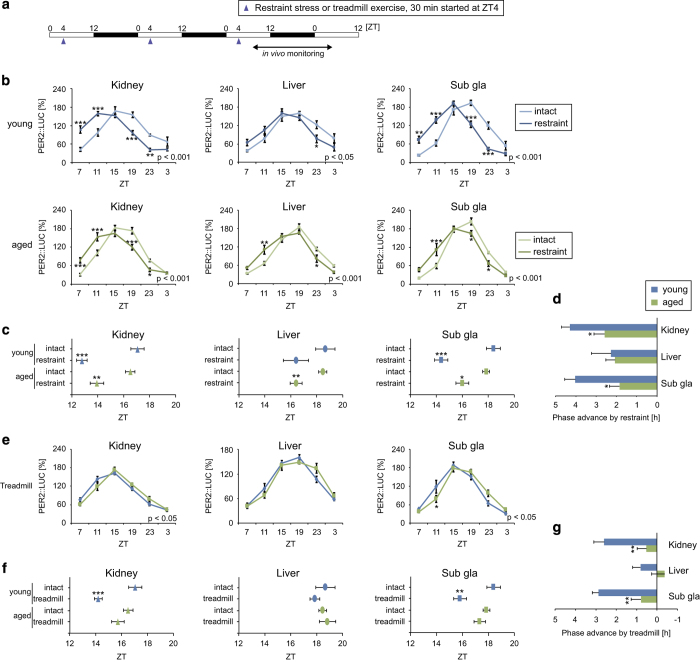
Figure 5.
Peripheral PER2::LUC rhythms in response to daily scheduled restraint stress or treadmill exercise. (a) Experimental restraint stress and treadmill exercise schedules. White and black bars indicate the light and dark periods, respectively. Arrowheads indicate stimulation timings. ZT, zeitgeber time. (b–g) Analyzed wave forms (b and e), peak phases (c and f), and phase change values (d, g) of PER2::LUC bioluminescence in the kidney, liver, and submandibular gland (sub gla) of young and aged mice in each condition. Phase advance values were calculated as the difference between the peak times of the restraint/treadmill group and the intact group. Values are expressed as the mean±s.e.m. The number of mice used is indicated in Supplementary Table S1. *P<0.05, **P<0.01, ***P<0.001 versus the young group or the intact group (Student’s t test or two-way analysis of variance (ANOVA) with Sidak’s or Tukey’s post hoc tests). The P value on the lower right side of each figure (b, e) indicates the result of a two-way ANOVA on the intact and restraint groups or the young and aged groups.

