
Figure 4.
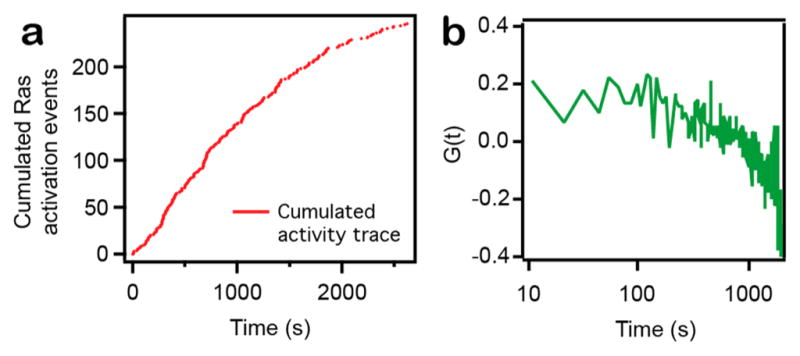
Evidence for long time scale state transition in SOS activity. (a) Cumulated Ras activation events as a function of time (trace acquired with SOSDPC). Note the decreased turnover activity toward the end of the trace. (b) Normalized autocorrelation of waiting times for a SOSDPC trace exhibiting a nonzero G(t), indicative of dynamically disordered enzymatic activity.