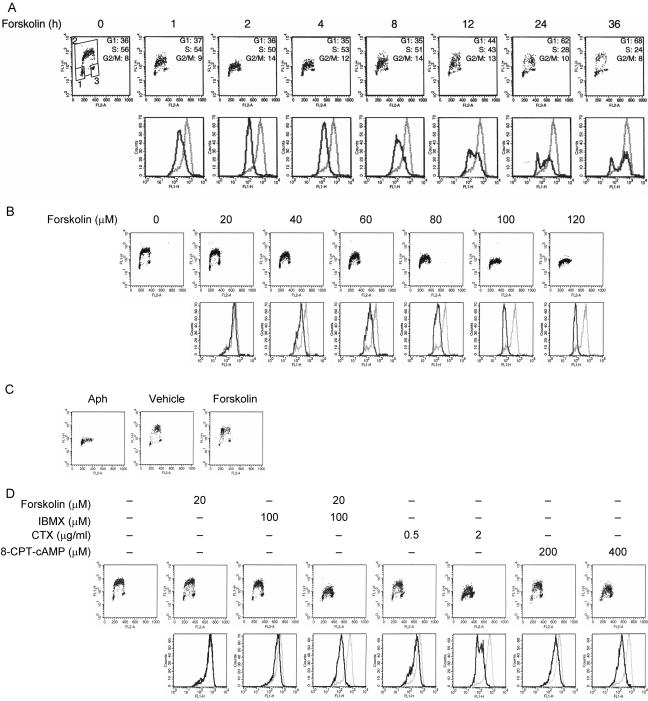
Figure 1.
Inhibition of DNA replication by cAMP. (A) Asynchronously proliferating Reh cells were cultured in the absence or presence of 100 μM forskolin. Cells were pulse-labeled with BrdU during the last 30 min of treatment before harvesting at the indicated times. Cells were fixed, stained with FITC-coupled anti-BrdU antibody and PI, and analyzed by flow cytometry to determine BrdU incorporation and cell cycle distribution. Top: representative scatter plots with the log FITC anti-BrdU staining (FL1-H) versus PI staining (FL2-A). Cell cycle distribution of cells was calculated using the gates shown in the leftmost plot. 1, G1 phase; 2, S phase; 3, G2/M phase. Bottom: the relative rate of BrdU incorporation was visualized by plotting FITC anti-BrdU staining in S phase cells. Gray lines, no treatment; black lines, treatment with forskolin. (B) Reh cells were treated with increasing concentrations of forskolin for 2 h and pulsed with BrdU for the final 30 min of treatment. Cells were processed as in A for detection of BrdU incorporation and cell cycle phase determination. Top: representative scatter plots with the log FITC anti-BrdU staining (FL1-H) versus PI staining (FL2-A). Bottom: the relative rate of BrdU incorporation was visualized by plotting FITC anti-BrdU staining in S phase cells. Gray lines, treatment with vehicle; black lines, treatment with forskolin. (C) Reh cells were synchronized in early S phase with Aph as described in Materials and Methods. Cells were then washed to remove Aph, incubated in drug-free medium for 2 h, and then pulse-labeled with BrdU for 20 min. Subsequently, BrdU was removed by extensive washing, and cells were incubated in the absence or presence of 100 μM forskolin for 2 h. Cells were then harvested and processed for visualization of BrdU-positive cells to monitor progression through S phase. (D) Reh cells were treated with forskolin (20 μM), or IBMX (100 μM) alone or the combination of two, CTX (0.5 or 2 μg/ml), or 8-CPT-cAMP (200 or 400 μM) for 2 h, and pulsed with BrdU for the final 30 min of treatment. Cells were then processed as in A for detection of DNA synthesis and cell cycle phase determination. Top: representative scatter plots with the log FITC anti-BrdU staining (FL1-H) versus PI staining (FL2-A). Bottom: the relative rate of DNA synthesis was visualized by plotting FITC anti-BrdU staining in S phase cells. Gray lines, no treatment; black lines, treatment with indicated agents.

