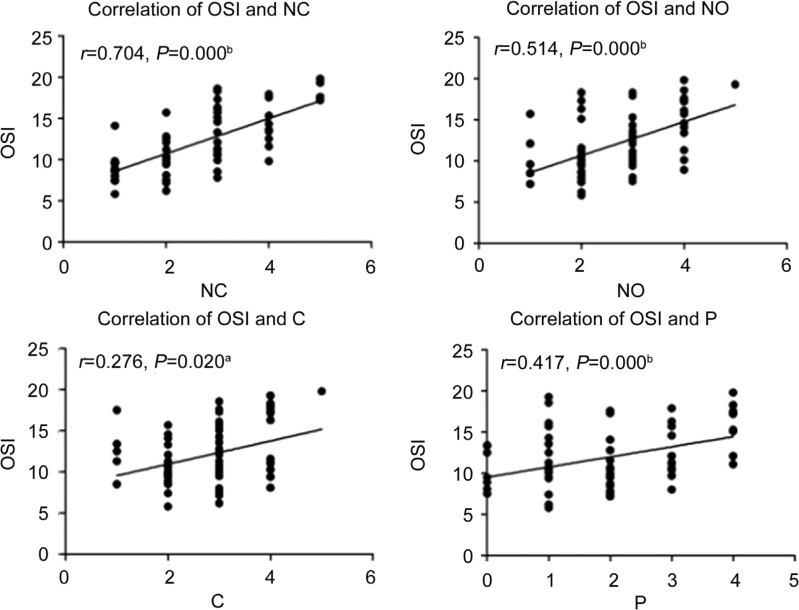
Figure 4. Correction of OSI and lens density preoperatively.
There were positive linear correlations between the OSI value and the lens LOCUS III value of nucleus color (NC), nucleus opacity (NO), cortex (C) and posterior lens capsular (P) (r=0.704, P=0.000; r=0.514, P=0.000; r=0.276, P=0.020; r=0.417, P=0.000, respectively). aP<0.05, bP<0.01.

