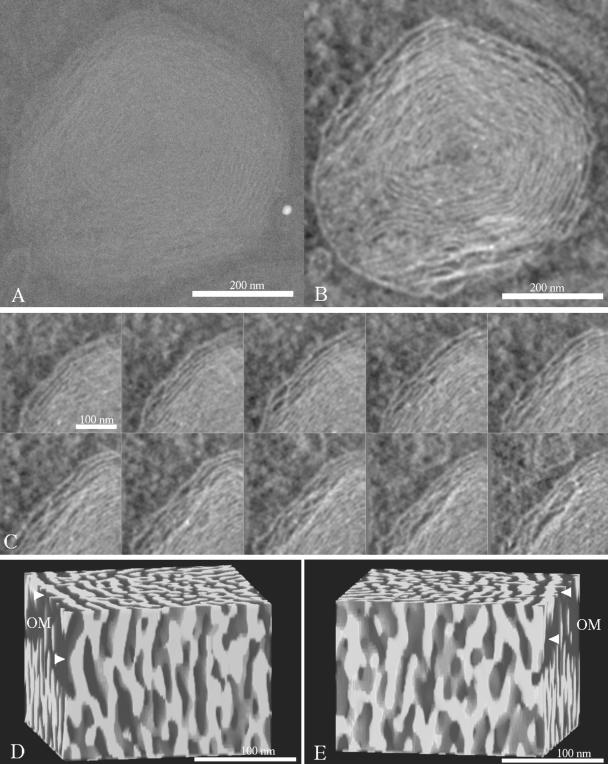
Figure 7.
Electron tomography of mitofilin-depleted mitochondria. (A) Projection image of a 250-nm-thick section of a representative mitochondrion in a siRNA-treated HeLa cell. (B) Central 3-nm slice from the reconstructed volume. (C) Series of 3-nm slices spaced 15 nm apart, of the upper left region in B. (D and E) Volume rendering of the membranes in a 200 × 200 × 250-nm3 block within region (C). Views D and E are rotated by 180°. The mitochondrial outer membrane (OM) is marked by arrows.

