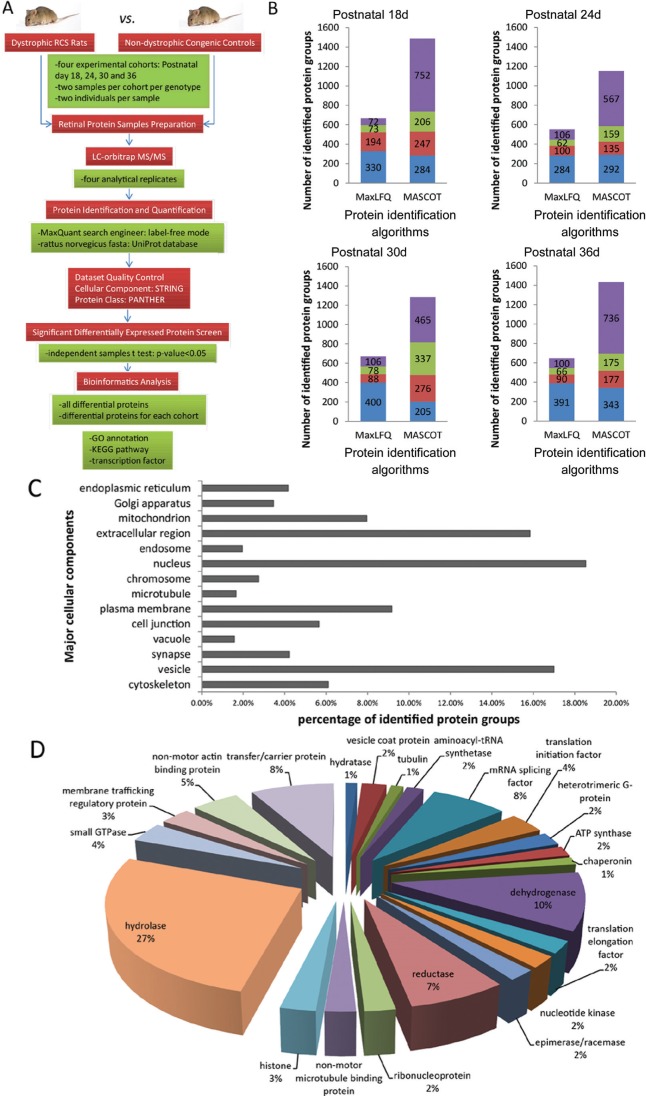
Figure 1. Protein identification of retina samples from model rats using LC-orbitrap MS/MS.
The process of sample preparation, data acquisition, and data analysis is shown in the flowchart (A). Proteins from RCS rat retina in sample #1 identified by MaxLFQ and MASCOT yield 841 (669, 552, 672 and 647 in each age cohort) and 4518 (1489, 1153, 1283 and 1431 in each age cohort) protein groups, respectively (FDR<1%). Blue column represents the number of protein groups observed in every experiment, while red column in three and olive column in two, and violet column in only one (B). The percentage of major cellular components is presented as a bar chart and shows the population distributions of all identified protein groups in various subcellular compartments (C). All of the retinal proteins of RCS rats identified by MaxLFQ were categorized by Protein Class with PANTHER database, ranking hydrolase proteins to the top with the largest proportion (D).

