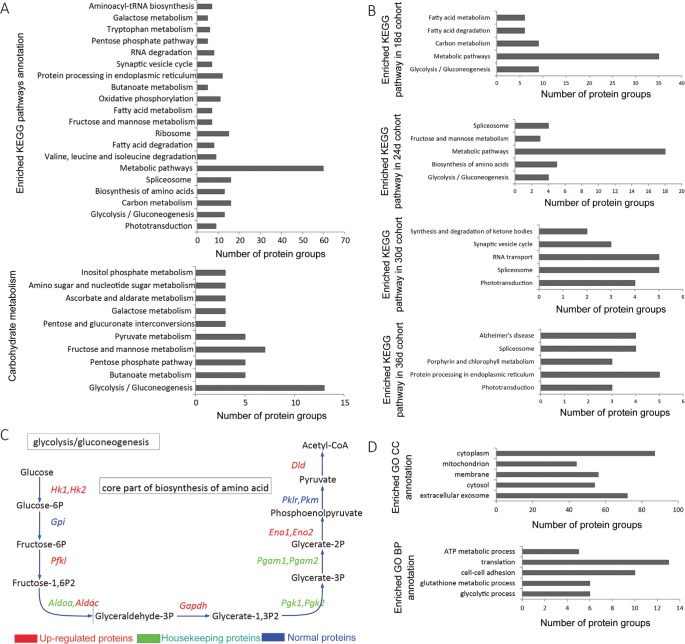
Figure 4. Enriched KEGG pathway analysis of significantly differentially expressed proteins and mapping of the glycolysis/gluconeogenesis pathway.
Enriched KEGG pathways categories were presented as a bar chart of 20 over-represented pathways. Carbohydrate metabolism pathways (16 DEPs), especially glycolysis/gluconeogenesis (13 DEPs), has drawn great attention with a high enrichment significance (A). The top five enriched KEGG pathways annotation for each age cohort show that the protein groups involved in glycolysis/gluconeogenesis pathway may play an important role at early stage of retinitis pigmentosa (B). In 18d cohort, the DEPs involved in glycolysis/ gluconeogenesis were significantly up-regulated (C). Enrichment analysis of GO CC and BP annotation in 18d cohort were presented as a bar chart (D). Data were ranked by P-value corrected with the Boniferroni method.

