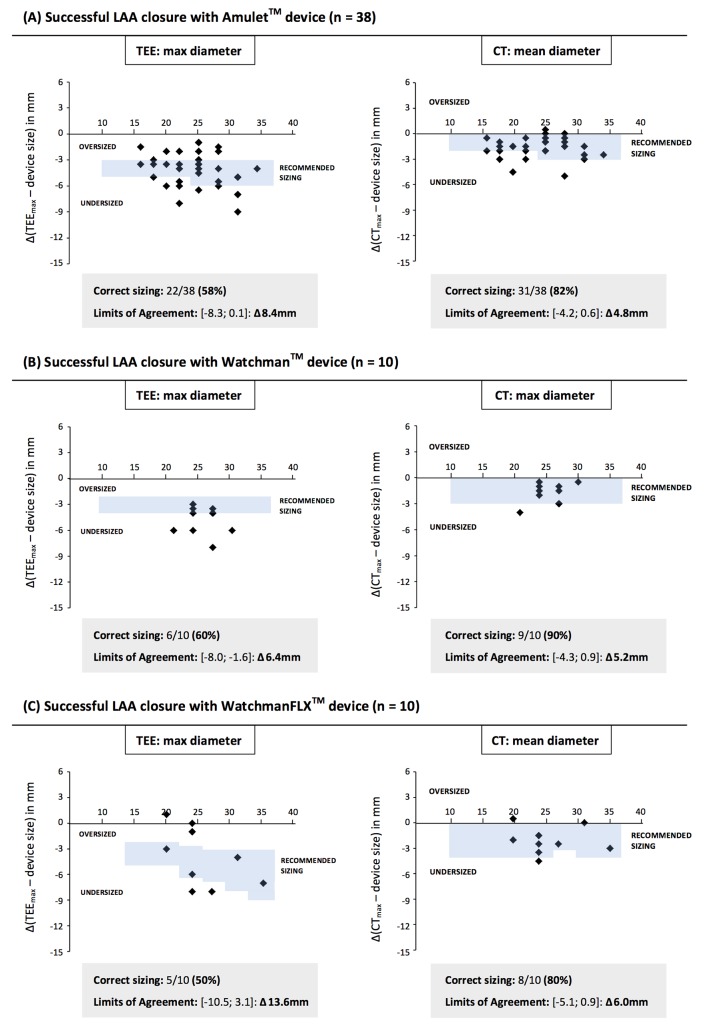
Figure 5.
Bland-Altman plots. The adapted Bland-Altman plots for 2D-TEE and optimal CT-guided LAA closure device sizing. This analysis only included successful percutaneous LAA closures (n=58). The plots show the difference between LAA sizing and final LAA closure device size for the different LAA closure devices and imaging modalities. Considering the official TEE-recommended sizing versus CT-based recommendation to select the first-available larger LAA device size (‘one step up’), the number of correct sizings per device and imaging modality could be calculated. LAA, left atrial appendage; TEE, transoesophageal echocardiography.

