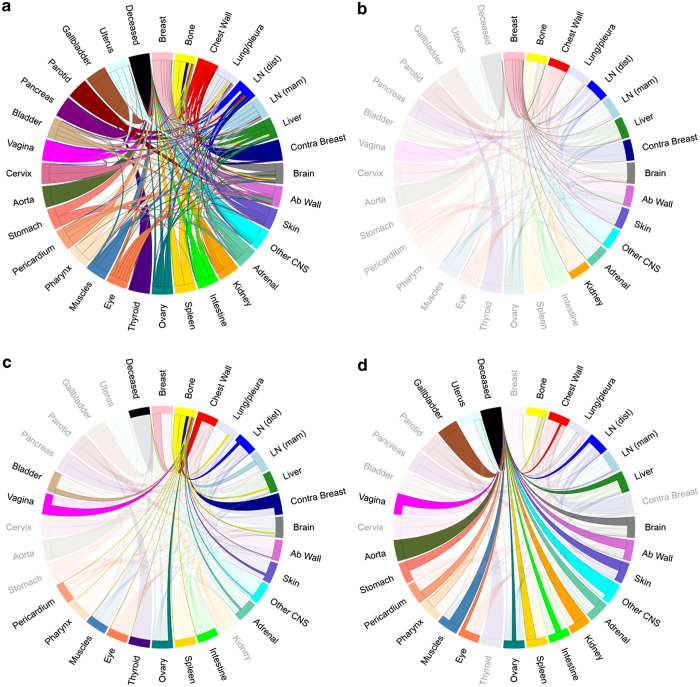
Figure 3.
Markov chain networks of metastatic breast cancer shown as circular chord diagrams. Chord widths at their respective starting locations represent one-step transition probabilities between two sites. Primary breast cancer is located on top with metastatic sites ordered clockwise in decreasing order according to transition probability from primary. (a) All patients’ network, (b) all patients’ network highlighting paths connected to the breast, (c) all patients’ network highlighting paths connected to the bone, and (d) all patients’ network highlighting paths connected to deceased.

