
Figure 4.
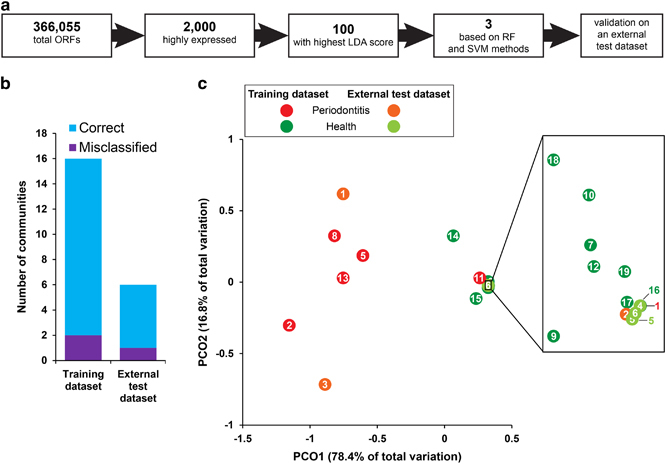
The biomarker candidates, their discovery and validation. (a) Flowchart for the biomarker selection and validation procedure. Reads were mapped against the HOMD database. LDA scores were calculated with linear discriminant analysis (LDA) for the 2,000 most highly expressed ORFs using the LEfSe algorithm.31 The top 100 ORFs with the highest LDA scores were further evaluated using the RF and SVM methods leading to the discovery of the three best biomarkers. They were validated using data from an independent study published previously. (b) Comparison between prediction based on the three biomarkers and clinical diagnosis. The classification model was tested on 22 samples. The 16 training samples are from our own study; the six external samples are from ref. 17. All the training samples were correctly classified except for two outliers. From the external data set, all but one sample were correctly classified. (c) Principal components analysis (PCA) was based on the three biomarker candidates. Euclidean distances were calculated on standardised abundances of reads from the three biomarker genes and scaled into the range of 0 to 1. Part of the plot was enlarged to clearly show the positions of densely packed samples. ORF, open reading frame; RF, random forest; SVM, support vector machine.