
Figure 3.
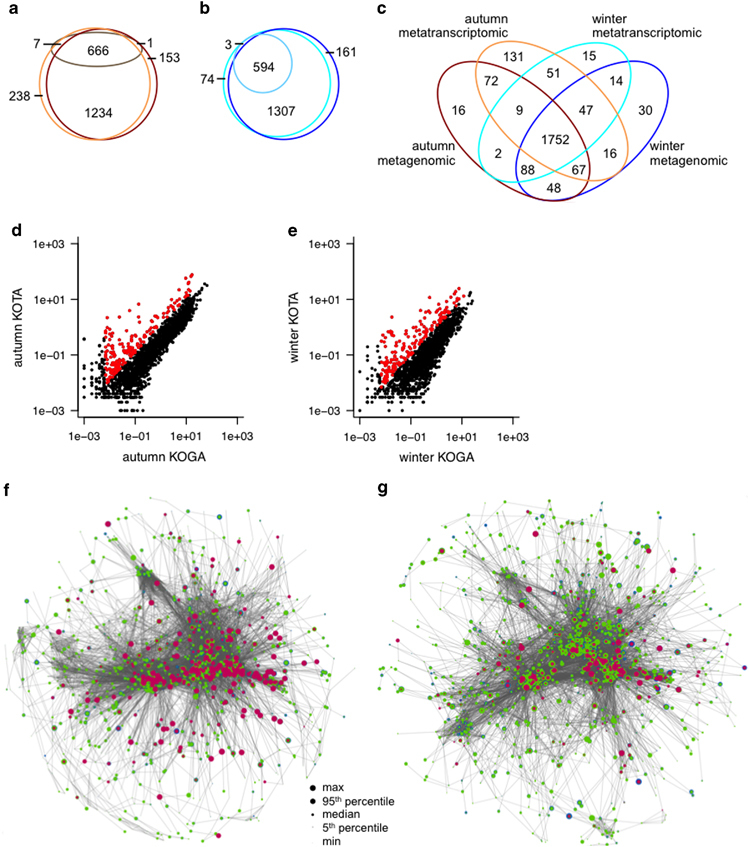
Integration of metagenomic, metatranscriptomic and metaproteomic data. (a) Venn diagram highlighting subsets of KEGG orthologous groups (KOs) in metabolic pathways present in the metagenomic (dark brown), metatranscriptomic (orange) and metaproteomic (pale brown) data from the autumn sample. (b) Subsets of KOs in metabolic pathways present in the metagenomic (dark blue), metatranscriptomic (cyan) and metaproteomic (pale blue) data from the winter sample. (c) Comparison of occurrence of KOs in metabolic pathways in metagenomic and metatranscriptomic data sets from autumn and winter. (d) Comparison of KO gene copy abundance (KOGA) and transcript abundance (KOTA) of KOs in metabolic pathways in the autumn data set. (e) Comparison of KO gene copy abundance (KOGA) and transcript abundance (KOTA) in metabolic pathways in the winter data set. In d and e, highly expressed KOs are highlighted in red. (f) Simplified autumn-specific metabolic network reconstruction. (g) Simplified winter-specific metabolic network reconstruction. In f and g, size of nodes represents KO abundance at metagenomic (blue), metatranscriptomic (green) and metaproteomic (magenta) levels, respectively. KEGG, Kyoto Encyclopedia of Genes and Genome.