
Figure 4.
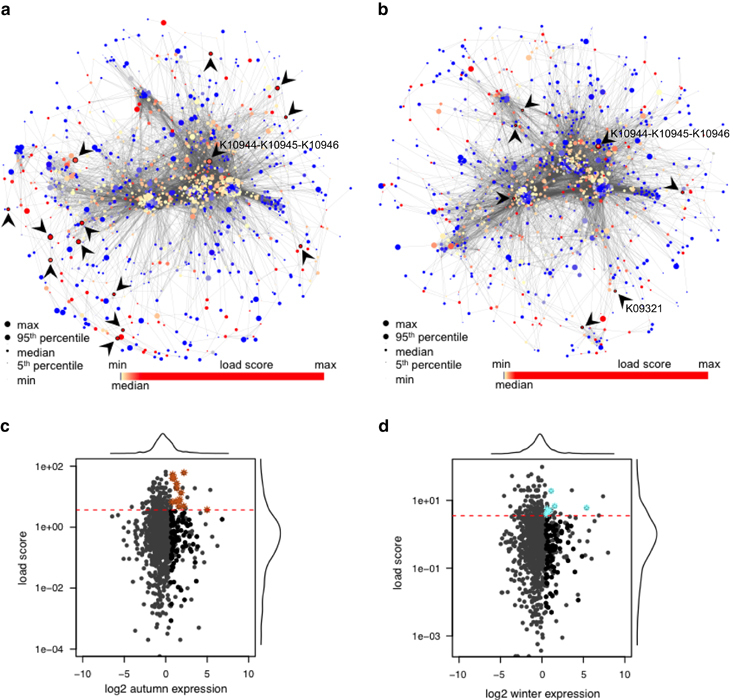
Topological analysis of the reconstructed season-specific community-wide metabolic networks and assessment of relative gene expression. (a) Autumn- and (b) winter-specific networks. In (a) and (b) node colours refer to load score and node sizes represent relative gene expression. KOs encoding key functionalities are encircled and highlighted by arrow heads. (c and d) Results of the topological analysis of KOs in simplified season-specific networks for (c) autumn and (d) winter. Highly expressed genes are indicated as black dots and KOs encoding key functionalities are indicated by brown (autumn) or cyan (winter) asterisks. Dotted red lines indicate minimal load score of KOs deemed to encode key functionalities.