
Figure 2. Analysis of spatial distribution of RNA exosome complex and RNA helicase Mtr4 in the nucleus of mouse B cells.
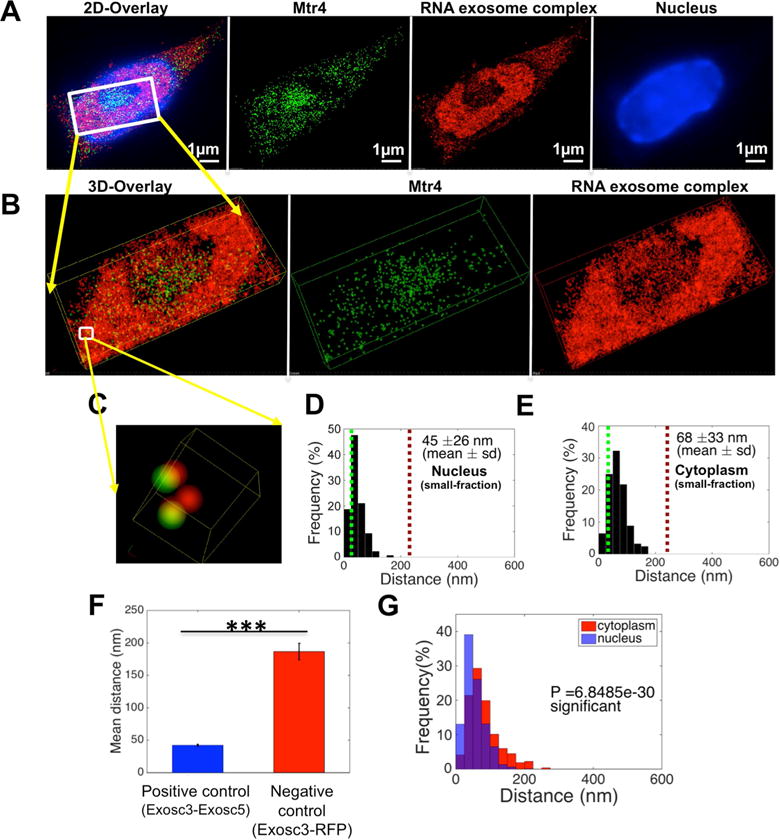
B cells were harvested from Exosc3 TAP-tagged mice and treated with stimulation cocktail for 72h. (A) Reconstructed two color STORM image from: a data set of 50,000 frames with Atto488 labeled Mtr4, AlexaFluor647 labeled RNA exosome complex and DAPI labeled nucleus. (B) Three dimensional views of the boxed region. (C) Higher magnification three dimensional [3D] views of the boxed region in panel B. (D), (E): Histogram plot of distribution of pair interaction of Mtr4 and RNA exosome complex calculated in (D) the nuclear sub-compartment and (E) the cytoplasm by using custom written algorithm “Nearest Neighbors Search” in Matlab (2014b, MathWorks) software. (F) Comparison of the distribution of paired interaction of Exosc3 and 5 in the B cell for positive control and RFP-HA tag & RNA exosome complex in HEK293 cells for negative control. (G) Comparison of the distribution of paired interactions in the nucleus and cytoplasm for RNA exosome complex and Mtr4 was calculated using a Student’s t-test in Matlab (2014b, MathWorks) software and P values are indicated in the graph. All of the 3D STORM imaging was performed in three separate B cells (obtained from independent experiments) and repeated three or more times. 3D STORM super resolution image magnification is ×100. Scale bar: 1μm(A). Error bars indicate S.D. (P value: *** <0.001)