
Figure 3. Analysis of spatial distribution of AID and RNA exosome in the nucleus of mouse B cells.
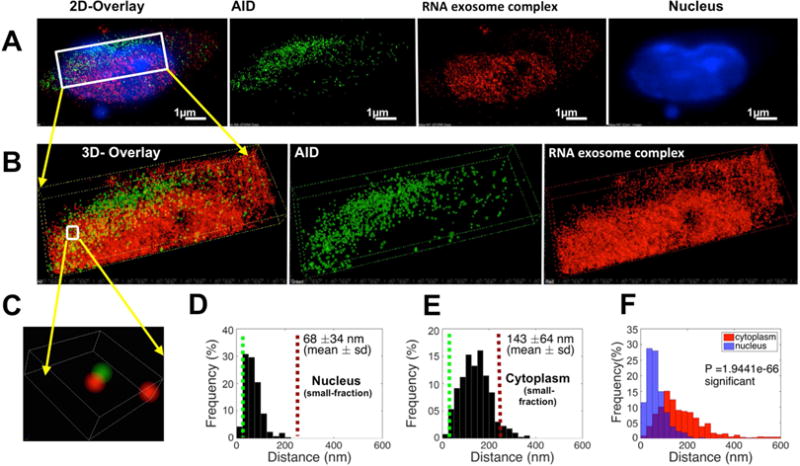
B cells were harvested from Exosc3 TAP-tagged mice following 72 hr of stimulation cocktail treatment (A) Reconstructed two color 3D STORM image from a data set of 50,000 frames with Atto488 labeled AID, AlexaFluor647 labeled Exosc3 and DAPI labeled nucleus. (B) Three dimensional views of the boxed region. (C) Higher magnification three dimensional [3D] views of the boxed region. (D) Histogram of the distribution of interactions of AID and the RNA exosome complex was calculated in the B cell nucleus and (E) in the cytoplasm, by Matlab (2014b, MathWorks) software. (F) Comparison of the distribution of paired interaction of AID and RNA exosome in the nucleus and cytoplasm were calculated by using a Student’s T-test in Matlab (2014b, MathWorks) software and P values are noted in the graph. All of the 3D STORM imaging was performed in three different B cells (from independent experiments) and repeated three or more times. 3D STORM super resolution image magnification is ×100 Scale bar: 1μm(A).