
Figure 4. Analysis of spatial distribution of AID and Mtr4 in the nucleus of B cells isolated from an Exosc10COIN/LacZ mouse.
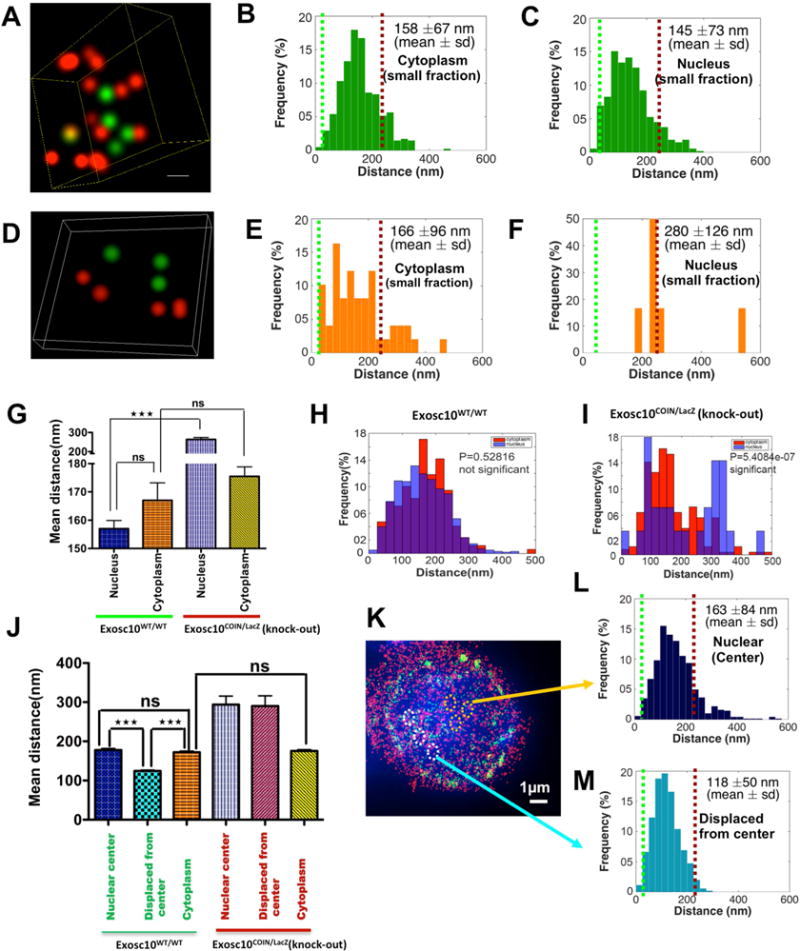
B cells were harvested from the spleen of an Exosc10COIN/LacZ mouse and fixed and prepared for 3D-STORM after 72 hrs of treatment with (1) stimulation cocktail and (2) 4OHT+stimulation cocktail. Reconstructed two color 3D STORM (super-Aresolution) image from a data set of 50,000 frames with Atto488 labeled AID, AlexaFluor647 labeled Mtr4 and DAPI labeled nucleus. Three dimensional views of the boxed region show spatial distribution of AID and Mtr4 molecules inside the nuclei of B cells isolated from (A) wild type cells and (D) Exosc10 knockout cells. Histogram of the distribution of interactions of AID and Mtr4 calculated in the B cell nucleus of (B) wild type & (E) Exosc10 knockout cells and in the corresponding cytoplasms (C) & (F), by using Matlab (2014b, MathWorks) software. (G) Comparison of the distribution of paired interaction of AID and Mtr4 in the nucleus versus cytoplasm by one way ANOVA (Tukey-Kramer test) method in Matlab (2014b, MathWorks) software. Comparison of the distribution of paired interaction of AID and Mtr4 were calculated in the cytoplasm versus nucleus of (H) wild type & (I) Exosc10 knockout B cells using a Student’s t-test in Matlab (2014b, MathWorks) software and P values are noted in the graph. (J) Comparison of the distribution of paired interaction of AID and Mtr4 in the nuclear center versus displaced from center versus cytoplasm by one way ANOVA (Tukey-Kramer test) method in Matlab (2014b, MathWorks) software. (K) Reconstructed two color 3D STORM (super-resolution) image with Alexa488 labeled AID, AlexaFluor647 labeled Mtr4 and DAPI labeled nucleus of wild type Exosc10 cells. Histogram of the distribution of interactions of AID and Mtr4 calculated in (L) nucleus center and (M) displaced from center of wild type cells, by using Matlab (2014b, MathWorks) software. All of the 3D STORM imaging was performed in three different B cells (from independent experiments) and repeated three or more times. 3D STORM super resolution image magnification is ×100. Scale bar: 1μm(K). Error bars indicate S.D. (P values: ** <0.01, *** <0.001)