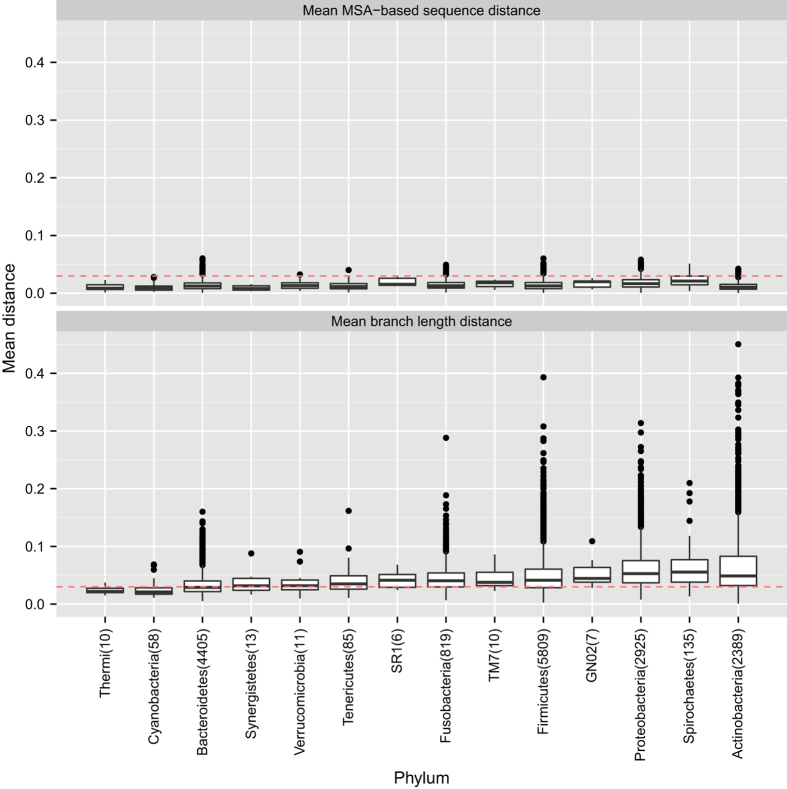
Figure 2.
Box plots of the mean MSA and BLD across the different phyla for the V3V5 OTUs. We report the distribution of the mean MSA-based sequence dissimilarity and mean phylogenetic branch length distance between the representative sequence and all other sequences within an OTU for the V3V5 OTUs. We group the distributions according to the OTUs’ phylum-level annotations. The red line delineates a distance of 0.03. We report the total number of OTUs that belong to that phylum in parenthesis.

