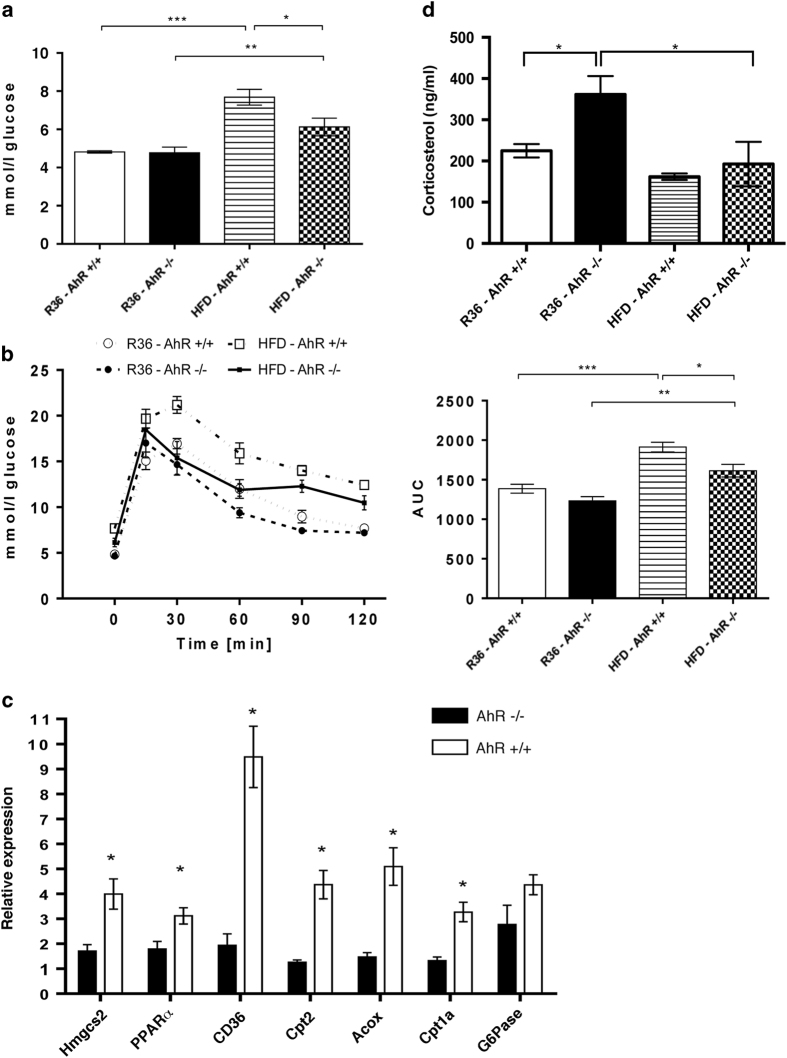
Figure 4.
A high-fat diet reduces nutritional stress on AhR−/− mice. Fasting glucose levels (a) and the oral glucose tolerance test (R36 AhR+/+, n=5 and AhR−/−, n=4; HFD AhR+/+, n=6 and HFD AhR−/−, n=4) (b), left panel: glucose changes over time; right panel: area under the curve (R36 AhR+/+, n=5 and AhR−/−, n=4; HFD AhR+/+, n=6 and HFD AhR−/−, n=4). (c) Quantitative RT-PCR results regarding the expression of Hmgcs2, PPARα, CD36, Cpt2, Acox, Cpt1a, and G6Pase in the livers of AhR−/− and AhR+/+ mice in response to high-fat diet (HFD) (R36 AhR+/+, n=5 and AhR−/−, n=4; HFD AhR+/+, n=6 and HFD AhR−/−, n=4). Gene expression was normalised to Hprt. *P<0.05, **P<0.01 against AhR+/+ mice (Student’s t-test). (d) Effect of chow (R36) and HFD on plasma corticosterol levels in AhR−/− and AhR+/+ mice (R36 AhR+/+, n=5 and AhR−/−, n=4; HFD AhR+/+, n=6 and HFD AhR−/−, n=4). Corticosterol level was measured in plasma by ELISA. Bars and error bars depict the mean±s.e.m.

