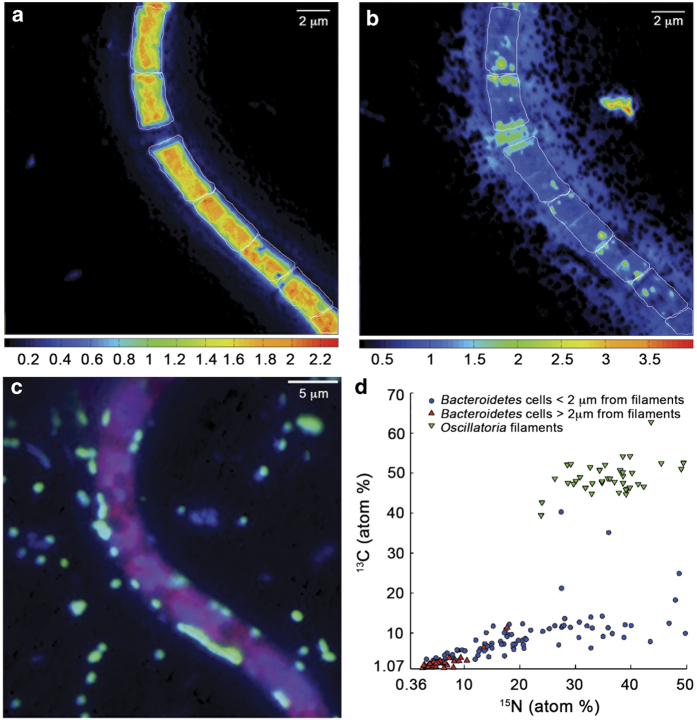
Figure 2.
Example of nanoSIMS isotope ratio images of an analysed Oscillatoria sp. filament for a the 13C/12C ratio (b) the 15N/14N ratio (c) the epifluorescence overlay used to confirm cell identification of hybridised Bacteroidetes cells (green), DAPI stained (blue) and an autofluorescent filament (red). White lines indicate regions of interest (ROIs) section of an analysed Oscillatoria sp. filament. (d) NanoSIMS analysis of 13C and 15N enrichment measurements atom % (AT%) for Bacteroidetes sp. cells based on proximity to filamentous Oscillatoria, and Oscillatoria cells (▼). Cells <2 μm from a filamentous cell (●), and cells >2 μm from a filamentous cell (▲).

