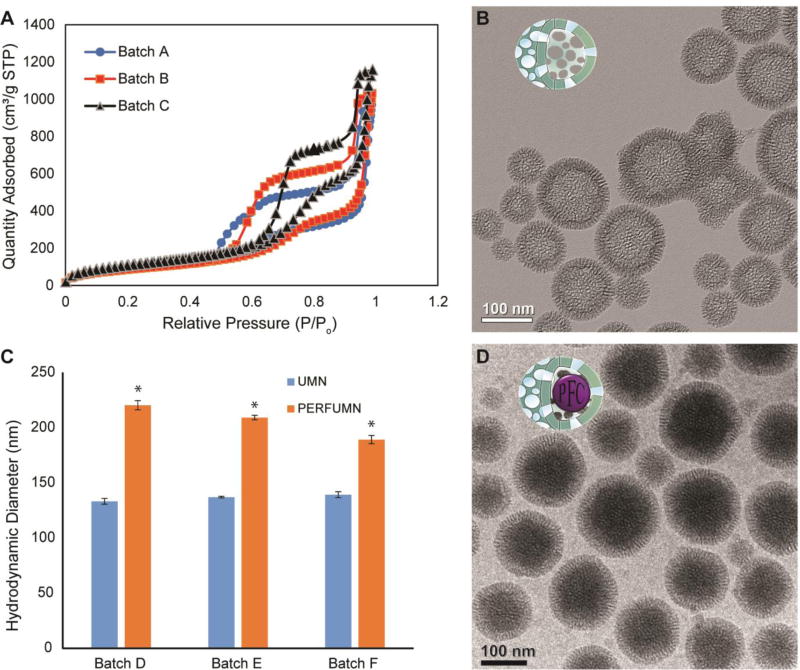
Figure 1.
Characterization data and images of nanoparticles. A) N2 physisorption data from replicate unloaded nanoparticle batches showing type IV isotherms with a type 5 hysteresis (H5) loop. B) TEM image of unloaded nanoparticles with hollow lacey cavities surrounded by silica wall with average thickness of 22 ± 1 nm (mean ± SEM). C) Triplicate, pair-wise, DLS diameter comparison between UMNs and PFCE-PERFUMNs; error bars are the standard error; PERFUMNs are statistically (* = p < 0.05) distinguishable from the unloaded nanoparticles. D) Cryo-TEM image of PERFUMNs; the previously hollow cavities now show a change in mass-thickness contrast, indicating the nanoparticles are packed by atomically heavy PFCs.

