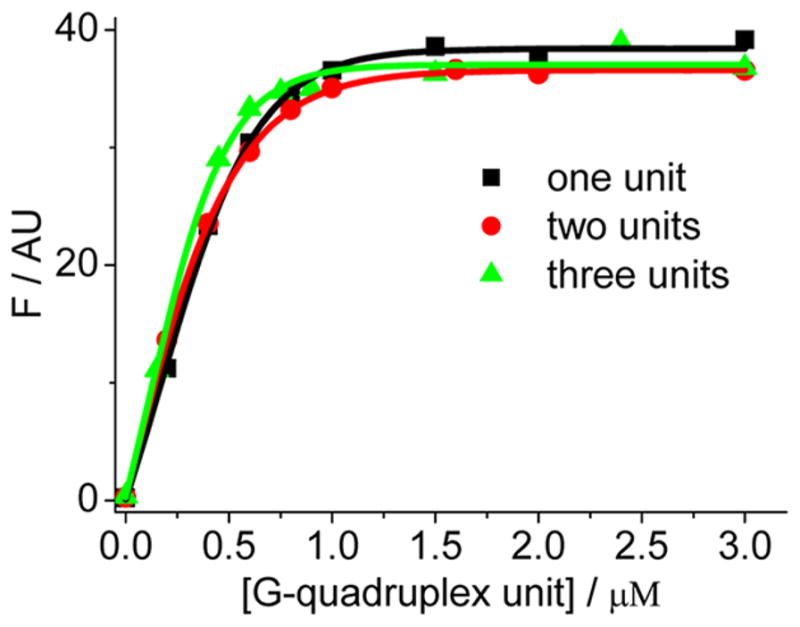
Figure 5.

Fluorescence intensity of EPI (0.5 μM) in 0.1 M K+ upon addition of increasing concentrations of 5′-(TTA[Q])nTTA-3′ containing one, two, and three G-quadruplex units with n = 1, 2, 3, respectively, showing a 1:1 binding by the curve fitting (solid line). The X-axis is based on the G-quadruplex unit concentration. The results based on the G-quadruplex strand concentrations are shown in Figure S9, This work was supported by the Zhejiang Provincial Natural Science Foundation of China for Distinguished Young Scholars (Grant No. LR12B05001), the Zhejiang Provincial Public Welfare Project (Grant No. 2014C31150), and the National Natural Science Foundation of China (Grant No. 21075112).
