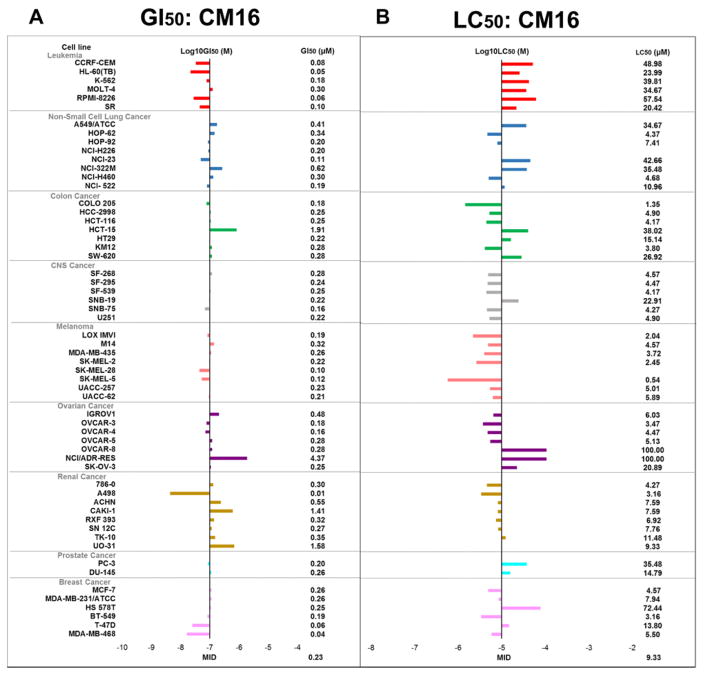
Fig. 2.
In vitro anti-cancer effects of CM16 in the NCI 60-cell line panel. (Adapted presentation - shown with the permission of the NCI) A: Global growth inhibition [GI50] of each cell line after 48 h of culture with CM16. “-7” represents the mean GI50 of the 60 cell lines, i.e. 0.2 μM. Log10 differences are represented by the bars. B: Lethal concentration [LC50] of CM16 for each cell line compared to the mean LC50 [“-5”]. The scale of the bars is in log10 as for A and B.

