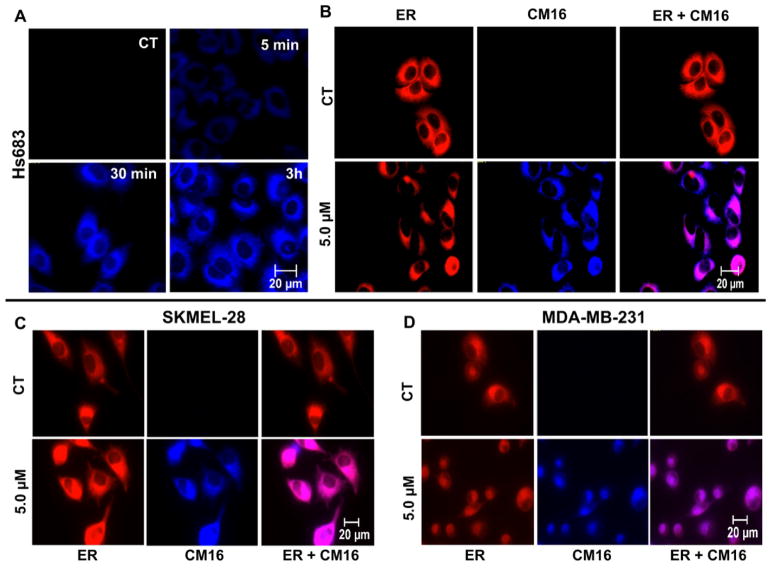
Fig. 4. CM16 cellular penetration and distribution in the ER and protein synthesis inhibitio.
A: CM16 fluorescence properties allow its visualization in blue color (filter ex/em: 359–371/397 nm) in Hs683 cells over time after 5 μM treatment. B: CM16 parallel distribution to the endoplasmic reticulum fluorescent probe (ER-tracker) after a 3 h treatment in Hs683, C: SKMEL-28 and D: MDA-MB-231 cell lines. Exposure times for blue filter (ex/em) 359–371/397 nm: 40 ms (SKMEL-28) and 80 ms (Hs683 and MDA-MB-231); and for red filter (ex/em) 540–580/593–668 nm: 283 ms (SKMEL-28) and 850 ms (Hs683 and MDA-MB-231). All pictures were taken with a 40× objective. Illustrations are representative of one experiment performed in two replicates.

