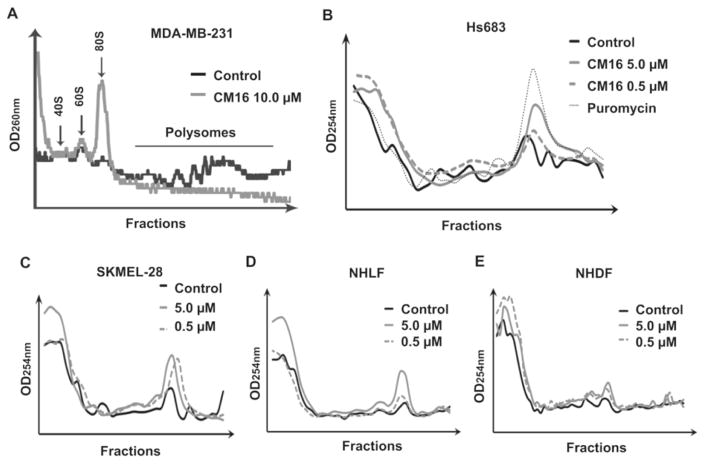
Fig. 6. CM16 effects on ribosomal organization by sucrose gradient analysis.
Effect of CM16 on ribosomal units and polysome organization after treatment. A: MDA-MB-231 cells incubated for 80 min with CM16 at 10 μM in comparison to the control. B: Cancerous cell lines Hs683 and C: SKMEL-28 and non-cancerous cell lines D: NHDF and E: NHLF incubated with CM16 at 0.5 μM or 5.0 μM for 3 h (grey lines) in comparison to the control (solid black line). Puromycin was used as positive control (1 h, 184 μM) to visualize the 80S peak containing fractions. Three or one independent experiments were performed, depending on the cell line. Each profile is representative of one experiment.

