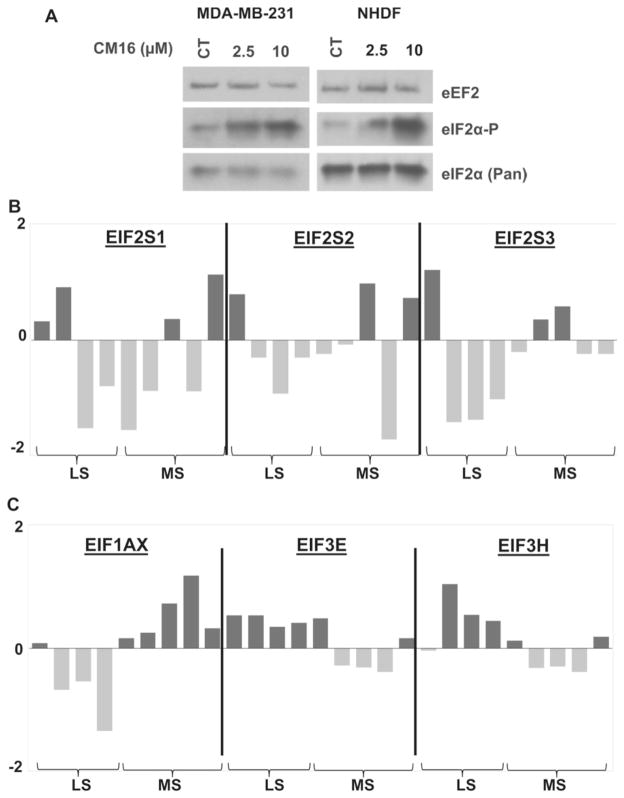
Fig. 7. Initiation factors study.
A: Effects of CM16 on the expression and phosphorylation status of eIF2α in MDA-MB231 cancerous and NHDF non-cancerous cells by western blot. Representative western blot of two experiments. B and C: Comparison of the transcriptomic expression levels of main translation initiation genes in the most (MS) versus least sensitive (LS) cell lines to CM16 effects among the NCI-cell-line-panel screening. The four least sensitive cell lines (i.e. those with a GI50 >1 μM) are HCT-15 [−5.72], NCI/ADR-RES [−5.36], Caki-1 [−5.85] and UO-31 [−5.80]. The five most sensitive cell lines (i.e. with a GI50 <0.1 μM) are A498 [−8.00], HL60 [−7.30], CCRF-CEM [−7.12], RPMI-8226 [−7.19] and T47D [−7.23]. B: Transcriptomic comparison of eIF2α, β and γ subunits between the most and least sensitive cell lines to the CM16 growth inhibitory effects identified in the NCI cell line panel. C: Transcriptomic comparison of the targets with significantly different expression levels between the cell lines most and least sensitive to CM16 growth inhibitory effects identified in the NCI cell line panel by means of t-test comparison. Increased expression levels as compared to the 60 cell line mean appear in black while decreased expression levels appear in grey. Results are expressed as Z scores as provided by the NCI database. Z scores are determined for each probe/cell line pair by the subtraction from its intensity of the probe mean (across the 60 cell lines), and division by the standard deviation of the probe (across the 60 cell lines). The z score average was then calculated as the mean across all probes and probe sets that passed quality control criteria.

