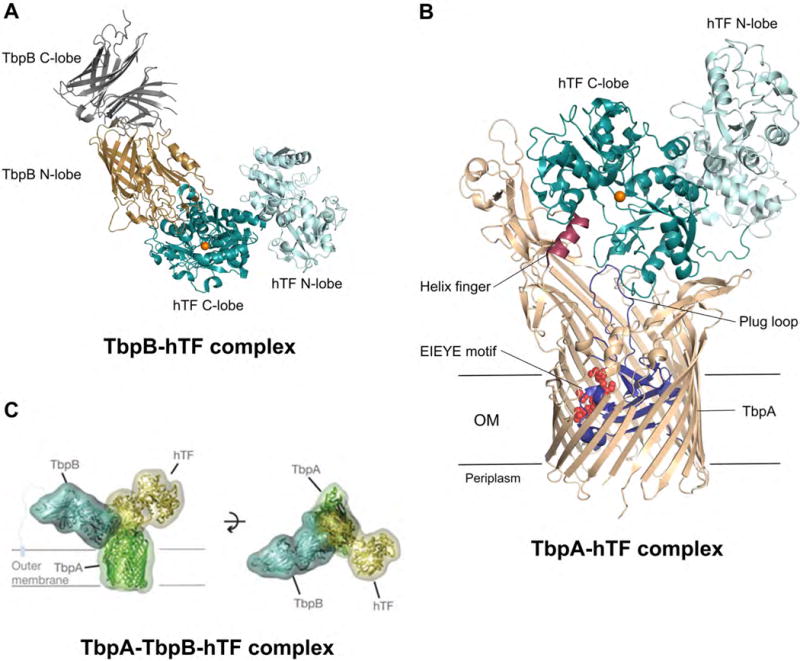
Figure 5.

Interaction of hTF with TbpAB of N. meningitidis. (A) Crystal structure of hTF bound to the co-receptor TbpB (PDB: 3VE1)[56]. TbpB is shown in gray/brown and TF is shown in teal/cyan. (B) Crystal structure of hTF bound to the TBDT TbpA (PDB: 3V8X)[55]. TF is shown in teal/cyan, TbpA in tan with the plug domain depicted in blue, and the helix finger and EIEYE motif in red; a Fe(III) ion has been modeled into the hTF C-lobe and is shown as an orange sphere. (C) Model of the ternary complex as determined by negative stain electron microscopy [55]. TF is shown in yellow, TbpA in green, and TbpB in cyan. The figure is reproduced with permission from Nature Publishing Group [55] Abbreviations: hTF, human transferrin; OM, outer membrane.
