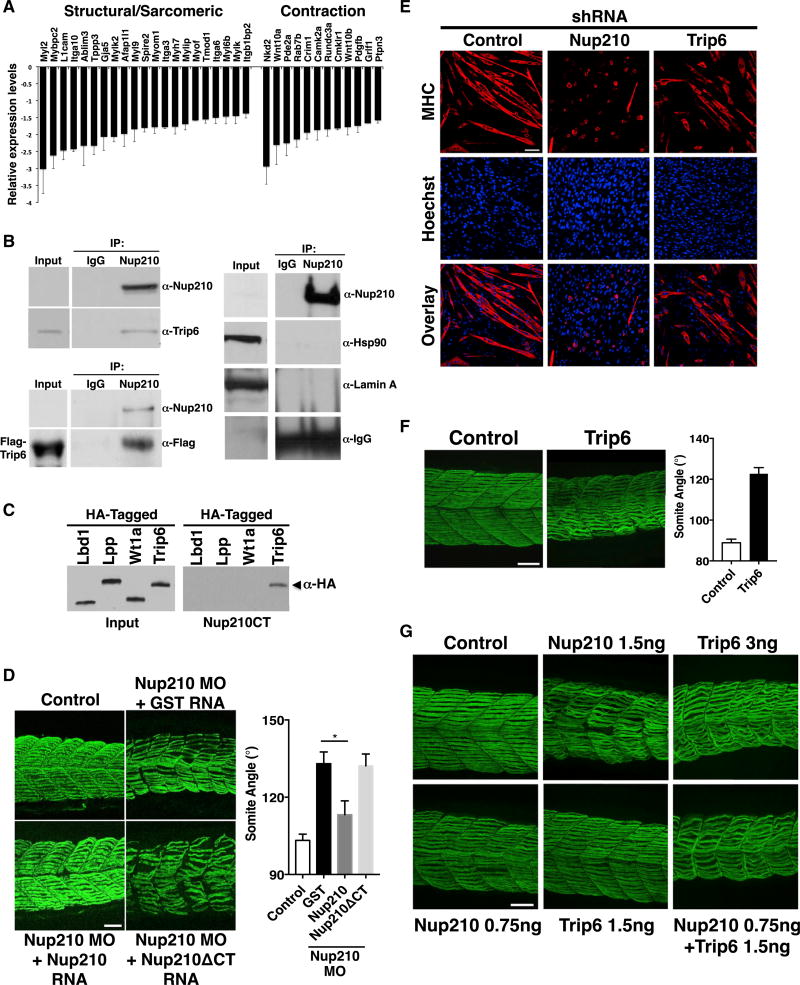
Figure 4. Nup210 Interacts with and Regulates Muscle Development through Trip6.
(A) The expression levels of several sarcomeric and muscle contraction genes in Nup210-depleted C2C12 myotubes was extracted from D’Angelo et al. (2012).
(B) Nup210 was immunoprecipitated (IP) from wild-type or FLAG-Trip6-expressing myotubes and the presence of Trip6 was determined using anti-Trip6 or anti-FLAG antibodies. Nup210 is expressed at low levels and is not detected in the input. Lamin A and Hsp90 were analyzed in Nup210 immunoprecipitates to determine the specificity of Trip6 binding (right panel). IgG, immunoglobulin G.
(C) The association of zebrafish Nup210 C-terminal domain fused to GST with different in vitro translated HA-tagged LIM-domain proteins was analyzed using pull-down assays.
(D) Embryos were co-injected with control or Nup210 morpholinos and mRNA for GST, full-length Nup210, or Nup210ΔCT, and muscle structure was analyzed 48 hpf with the F59 antibody. Myotome angle was used to quantify muscle alterations (n = 10–20 embryos, performed in triplicate).
(E) C2C12 cells were infected with lentiviruses carrying control, Nup210, or Trip6 shRNAs, selected and induced to differentiate. Differentiated myotubes were stained for myosin heavy chain (MHC) at 72 hr post differentiation. Nuclei were stained with Hoechst.
(F) Zebrafish embryos were injected with control or Trip6 morpholinos and slow muscle was stained with F59 at 48 hpf (left panel). Muscle alterations were quantified by measuring myotome angle (right panel). n = 10–20 embryos, performed in triplicate.
(G) Control, Nup210, or Trip6 morpholinos (top panel) and subphenotypic concentrations of Nup210, Trip6, or both morpholinos (bottom panel) were injected into one-cell zebrafish embryos and slow muscle was stained at 48 hpf. Bar plots represent mean ± SEM, n ≥ 3 replicates. *p ≤ 0.05. Scale bar, 50 µm. See also Figure S2.

