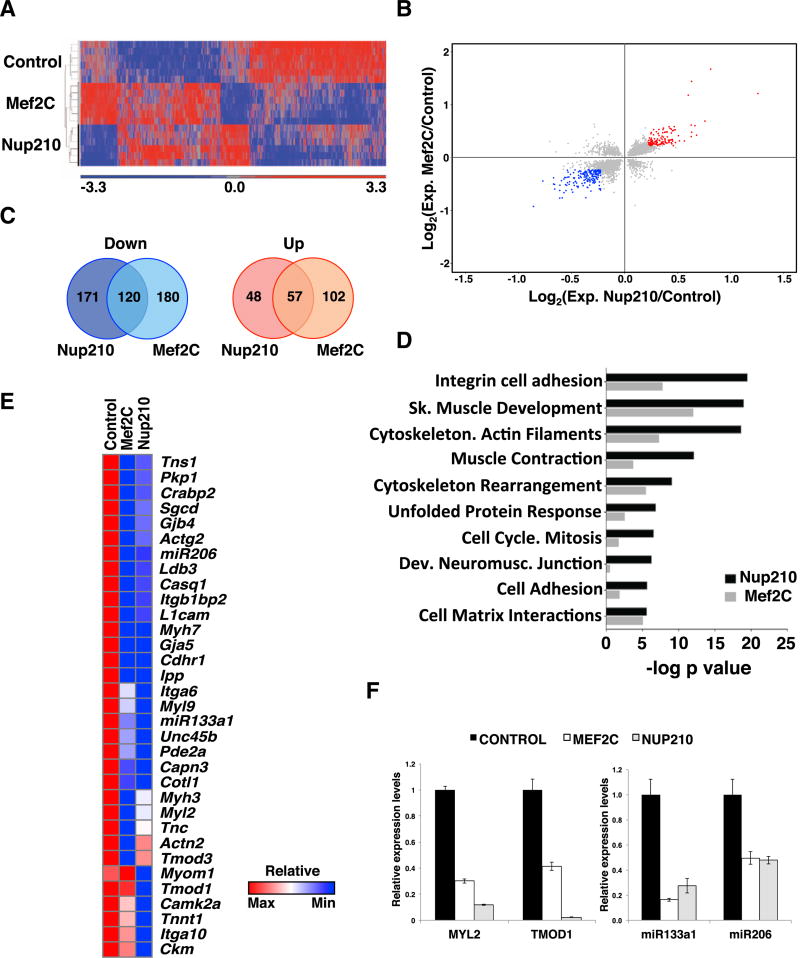
Figure 6. Nup210 and Mef2C Regulate a Common Set of Muscle Genes.
(A) Whole-genome gene expression was analyzed by microarray in C2C12 myotubes infected with lentiviruses carrying control, Nup210, or Mef2C shRNAs. Heatmap shows the gene expression patterns of Nup210- and Mef2C-depleted myotubes (2,410 common genes, p ≤ 0.05).
(B) Scatterplots of log2 gene expression changes in Nup210- and Mef2C-depleted myotubes (p ≤ 0.05). Genes changing ≥ 1.25-fold for Nup210 and Mef2C are shown in blue (down) or red (up). Gene expression values are mean changes of microarray sextuplicate samples.
(C) Venn diagram of down- and upregulated genes in Nup210- and Mef2C-depleted myotubes relative to scramble control (p ≤ 0.05, ≥ 1.25-fold change).
(D) Process enrichment for Nup210 and Mef2C co-regulated genes was analyzed using Metacore software.
(E) Heatmap for gene expression changes of sarcomeric, cell adhesion, and muscle contraction genes in Nup210- and Mef2C-depleted myotubes.
(F) The expression levels of Myl2, Tmod1, miR-133a-1, and miR-206 in Nup210 and Mef2C-depleted myotubes were analyzed by qPCR. mRNA levels for each gene were normalized to Hprt1 expression and are presented relative to scramble control-treated cells. Data represent mean ± SEM, n ≥ 3 replicates.
See also Figures S3 and S4.

