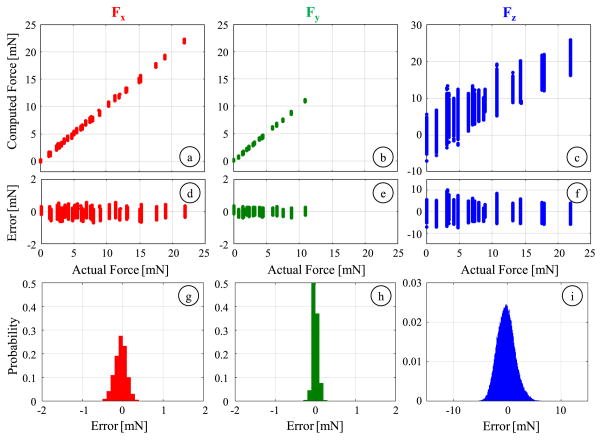
Fig. 14.
Results of the validation experiment for computing Fx (red), Fy(green) and Fz (blue): (a–c) The comparison of computed values to the actual force level, (d–f) variation of residuals with respect to the force magnitude, (g–i) probability distribution of residuals (bin size = 0.1 mN). Tested data consists of loading conditions that were not involved during calibration. The identified local nonlinear regression can still accurately predict the applied forces with rms errors of 0.16, 0.07 and 1.68 mN for Fx, Fy and Fz, respectively.

