
Fig. 1.
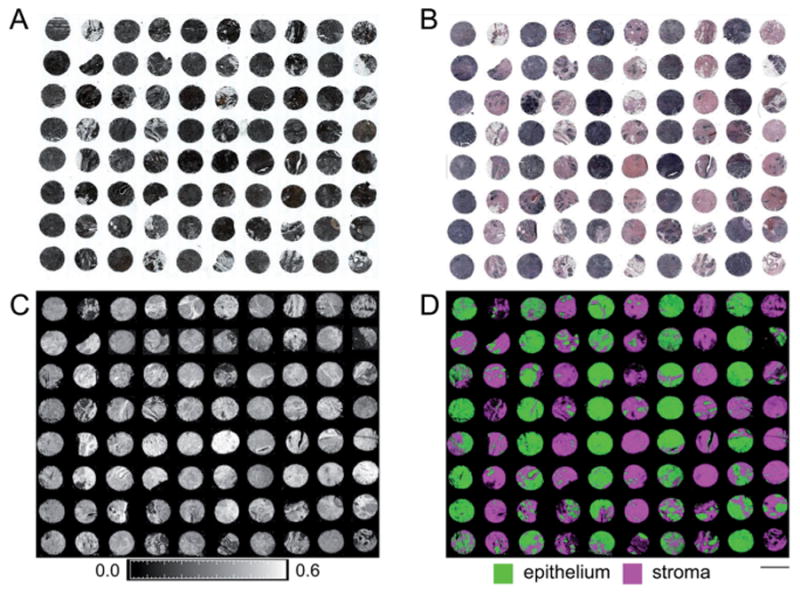
Two-class breast histology. (A) Minimal tissue and tumor characteristics are visible on unstained tissue. (B) Stroma and epithelium are visible on tissue stained with hematoxylin and eosin (H&E) dyes. (C) Image of tissue absorbance, as per color bar scale below the image, of unstained tissue at 3294 cm−1 highlights differences in tissue, especially between stroma and epithelium. (D) Quantitative spectral data permits automated segmentation of stroma and epithelium, as noted by the color code below the image, without dyes or contrast agents. The scale bar represents the 1.5 mm diameter of a single core on this TMA.