
Fig. 2.
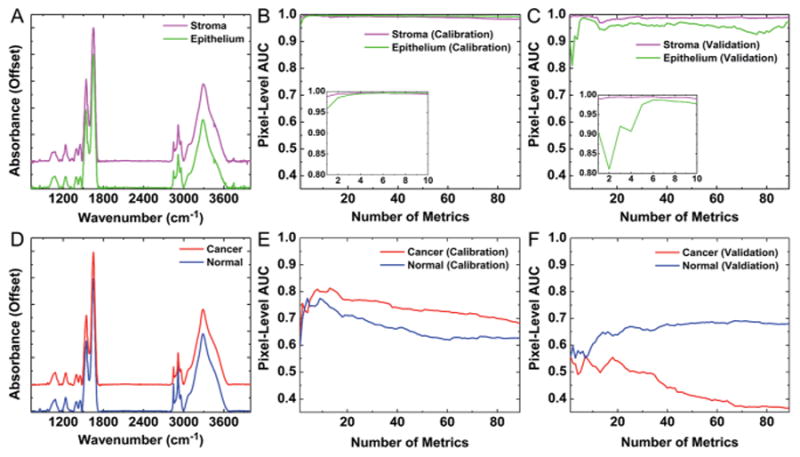
Automated histology and pathology using only spectral metrics. (A) Average spectra for stroma and epithelium demonstrate clear biochemical differences between these cell types. (B) Spectral metrics provide accurate histologic segmentation of stroma and epithelium with AUC values of ∼1 for each tissue class with only 6 metrics. (C) This classification is reproducible in validation on separate tissue samples. (D) Average spectra for cancer and normal epithelium indicate biochemical changes are less obvious in disease development. (E) ROC analysis indicates that spectral metrics demonstrate reduced discrimination in cancer and normal epithelium pixels with a maximum cancer pixel-level AUC of only 0.81. (F) Spectral metrics do not provide reproducible pathology discrimination, as demonstrated by a low cancer pixel-level AUC of 0.55 in validation samples.