
Fig. 4.
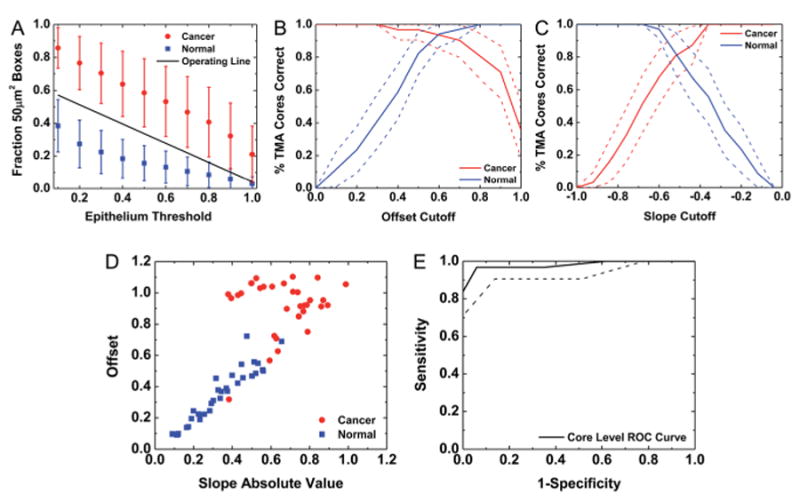
Tumor TMA core segmentation by spatial polling. (A) A TMA core was divided into 8 × 8 pixel (50 μm2) boxes and the fraction of boxes with epithelium content above a set of thresholds for each TMA core was computed. The mean value for cancer and normal classes was computed, and error bars represent standard deviation. An operating line was obtained for tumor TMA core classification. (B) A linear fit was calculated for each TMA core and the y-intercept offset cutoff for cancer detection was varied to assess classification sensitivity and specificity with this variable. (C) The slope cutoff for cancer detection was also varied to assess classification sensitivity and specificity with this variable. (D) A scatter plot of offset vs. slope absolute value for each TMA core demonstrates the contribution of each metric to tumor core identification. (E) The ROC curve indicates near-perfect tumor classification. The area between the dotted lines represents a 95% confidence region for the mean value.