
Fig. 6.
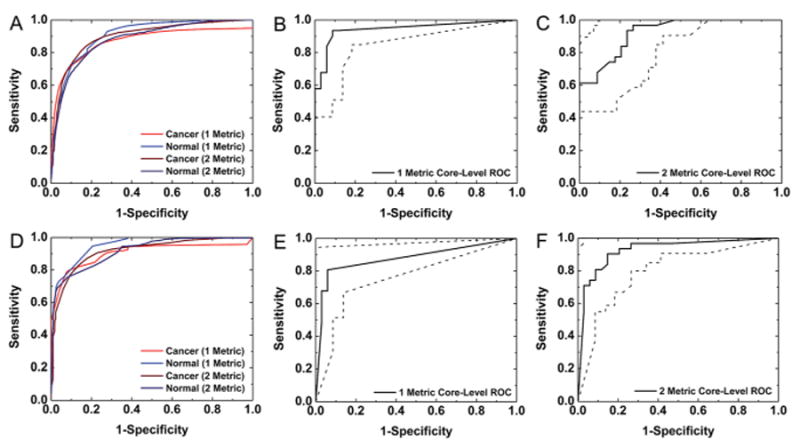
Classification with multiple types of spatial metrics. (A) ROC analysis for multiple classification models for pixel-level cancer and normal segmentation using metrics computed from a box size range of 4 × 4 pixels to 80 × 80 pixels demonstrates some improvement in pixel-level cancer sensitivity with multivariate classification. (B) ROC analysis for core-level classification with a single metric of mean fraction for an 80 × 80 box indicates accurate overall tumor identification. (C) Core-level specificity is somewhat reduced with the addition of a standard deviation spatial metric for this 80 × 80 box size classifier. (D) ROC analysis for univariate and multivariate classification models for pixel-level cancer and normal segmentation using metrics computed from a box size range of 4 × 4 pixels to 160 × 160 pixels demonstrates some improvement with multivariate classification. (E) ROC analysis for core-level classification with a single mean fraction metric for a 160 × 160 box indicates reduced sensitivity in tumor detection. (F) Core-level sensitivity is improved with the addition of a standard deviation metric to this 160 × 160 box size spatial polling classifier. The areas between the dotted lines on the core-level ROC curves represent 95% confidence regions.