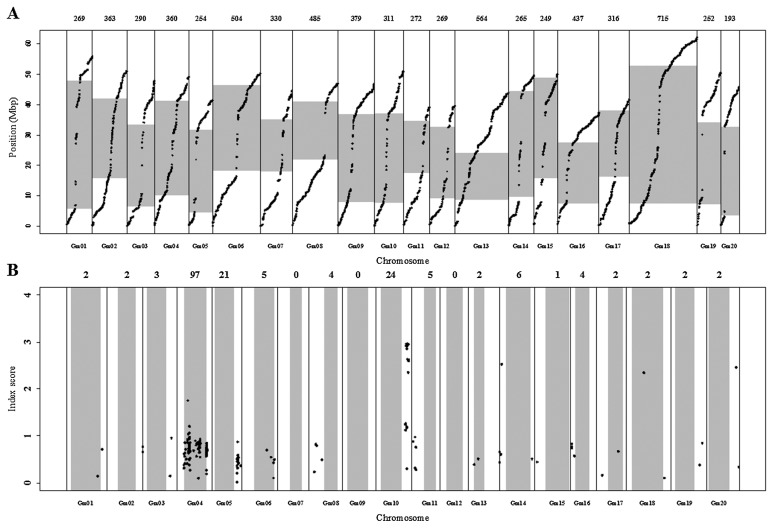
Fig. 2.
The physical distribution of SNPs (A) and the location of SNPs showing significant differences in genotype frequencies between the early and late bulks (B). (A) Physical locations of all 7077 SNPs used to evaluate regions with skewed genotype distribution by bulk segregant analysis. All SNPs were ordered according to their physical position. The number of SNPs on each chromosome is shown above the graph. (B) Positions of the SNPs with genotype frequency skewed between early and late bulks. The X-axis indicates physical positions of markers for each SNP/Indel locus. The Y-axis indicates the index score used to evaluate skewed genotype frequency. Black circles indicate loci whose index scores exceeded the threshold index score calculated with a permutation test with 1000 replications at a 1% significance level. The number of significant SNPs is shown above each chromosome. In (A) and (B), vertical lines separate chromosomes; gray boxes indicate pericentromeric regions.

