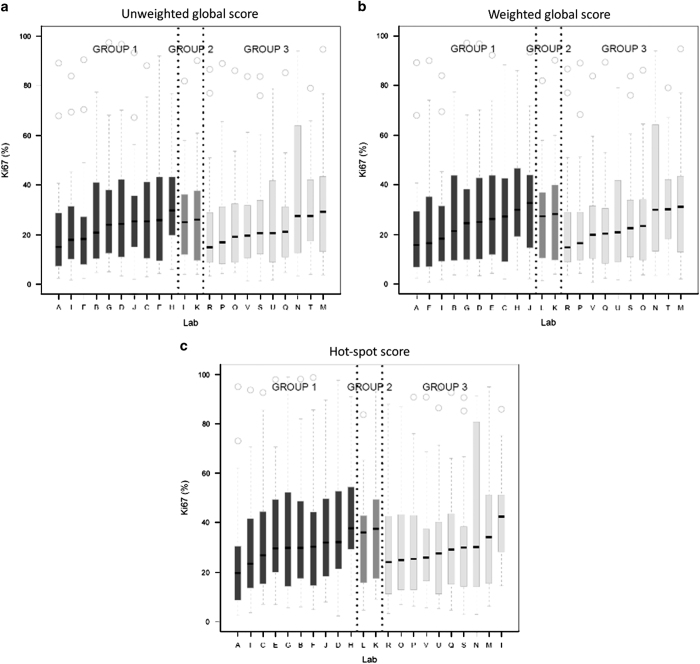
Figure 1.
Ki67 scores (a, unweighted global; b, weighted global; c, hot-spot) of all 22 laboratories (by group): black for Group 1, medium gray for Group 2, and light gray for Group 3. Laboratories are ordered (within each group) by the median scores. The bottom/top of the box in each box plot represent the first (Q1)/third (Q3) quartiles, the bold line inside the box represents the median and the two bars outside the box represent the lowest/highest datum still within 1.5×the interquartile range (Q3–Q1). Outliers are represented with empty circles.

