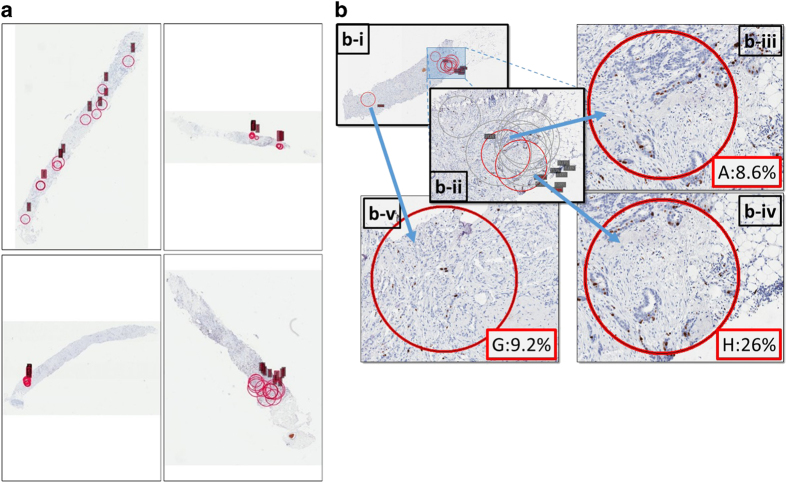
Figure 5.
Hot-spot field selection by different laboratories on the same core-cut biopsy slide. (a) Selections (indicated by red circles) on some example core biopsies. (b) Example of a single-core biopsy (median score: 12%) with zoomed-in fields. Each laboratory was asked to circle the area considered by that laboratory to be the hot-spot (b-i). Most pathologists honed in on the same area of the core, although individual-selected circular scoring fields do not always overlap. (b-iii, b-iv) Segments of the same area chosen by two different laboratories to read Ki67. (b-v) The ‘outlier’ field selected by only one laboratory as the hot-spot.

