Figure 2.
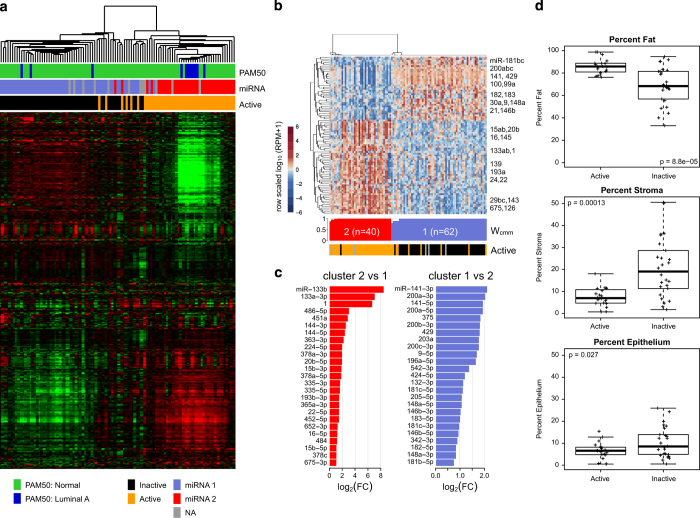
Expression characteristics of cancer-adjacent tissue samples. (a) Unsupervised gene expression clustering of RNA-sequencing data reveals two main clusters. Colored bars represent PAM50 subtype and miRNA subtype based on consensus cluster, and active/inactive subtype from Roman-Perez et al.13 (b) Normalized abundance heatmap for the a two-cluster NMF consensus clustering solution for microRNA profiles for 102 cancer-adjacent normals, for the 90 mature strands that had an absolute value fold change of at least 1.5 and a mean RPM of at least 25 in at least one of the two clusters. Below the heatmap, the silhouette width profile (W cmm) calculated from the consensus membership matrix. The covariate track shows samples scored as active versus inactive from mRNA data. (c) miRs that were differentially abundant (FDR<0.05) between two unsupervised clusters, for the largest 25 fold changes (FC), for miRs with FC>1.5 and a mean (RPM)>25 in at least one of the two clusters. (d) Association of mRNA clusters with fat, stromal, and epithelial percentages in normal tissues. FDR, false discovery rate; NMF, non-negative matrix factorization.

