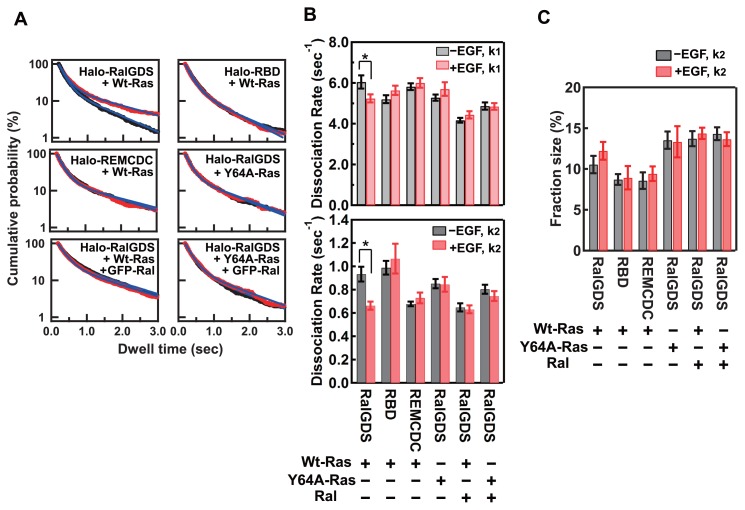
Figure 4.
Dissociation kinetics for RalGDS from the plasma membrane components. (A) Dwell time distributions of Halo–RalGDS constructs coexpressed with small G-proteins on the basal plasma membrane before (black) and 3 min after (red) EGF stimulation. The blue lines are the best-fit curves of the two-component exponential function described in the “METHODS”. (B) Dissociation rate constants for the fast (k1, upper graph) and slow (k2, lower graph) dissociation components of RalGDS before (black bars) and 3 min after (red bars) EGF stimulation. The mean values for 5–8 cells are plotted along with the SE. Asterisks denote statistical significance (p<0.05 using the t test). (C) Fraction sizes for the slow dissociation component of RalGDS. The mean values for 5–8 cells are shown along with the SE.

