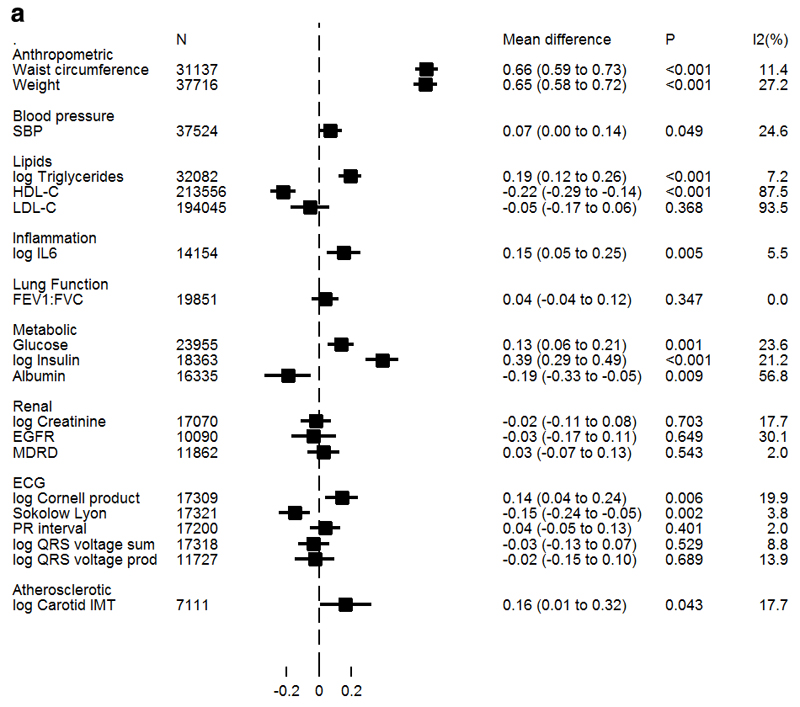
Figure 1a. Association of BMI with continuous biomarkers derived from Mendelian randomization analysis.
Values represent standardized mean differences of each trait per SD increase in BMI derived from conventional (IVW) Mendelian randomization analysis. Non-normally distributed variables were natural ln transformed; therefore mean differences displayed on the log scale may be anti-logged and interpreted as percentage differences in SD of trait per SD in BMI. Log triglycerides from individual participant data studies only; GLGC triglycerides in Supplemental Table 10.

