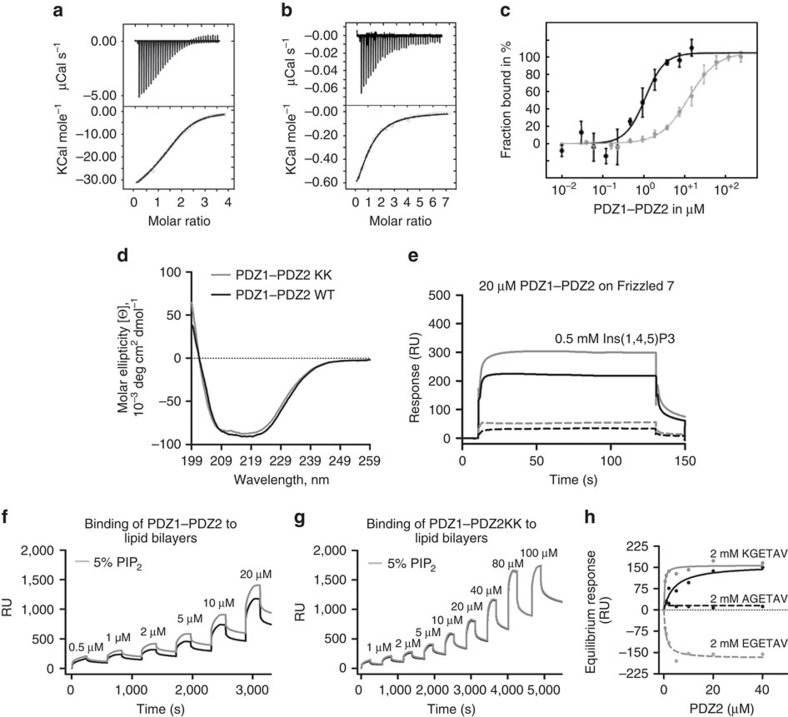
Figure 4. Frizzled 7 and PIP2 binding by the syntenin PDZ1–PDZ2 tandem.
(a) Isothermal titration calorimetry (ITC) titration of the PDZ1–PDZ2 tandem with Frizzled 7 8mer peptide. (b) ITC titration of the PDZ1–PDZ2 tandem with Ins(1,4,5)P3. Top half graphs (a,b) show data after base line correction and bottom half graphs show the integrated data corrected for the heat of dilution of ligands. (c) Titration curve for the interaction of the PDZ1–PDZ2 tandem with Frizzled 7 peptide in absence (grey symbols) or presence of Ins(1,4,5)P3 head group (black symbols) as measured by microscale thermophoresis (MT). The solid curves represent the best fit of the Hill’s equation to the experimental data. Error bars represent s.d. of the mean. (d) Circular dichroism (CD) experiments illustrating similar structural properties for the PDZ1–PDZ2 tandem wild-type (black line) and mutant K214A/K250A (grey line). (e) Blank-subtracted SPR sensorgrams. Binding of PDZ1–PDZ2 tandem wild-type (black continuous line) or PDZ1–PDZ2 tandem mutant K214A/K250A (black dotted line; 20 μM) over immobilized Frizzled 7 19mer. A fixed concentration of 0.5 mM Ins(1,4,5)P3 (IP3, PIP2 head group) was pre-incubated with PDZ1–PDZ2 tandem wild-type (grey continuous line) or PDZ1–PDZ2 tandem mutant K214A/K250A (grey dotted line; 20 μM) before perfusion over immobilized Frizzled 7 19mer. (f,g) Sensorgrams illustrating the binding of increasing concentrations of the PDZ1–PDZ2 tandem wild-type (f) and the PDZ1–PDZ2 tandem mutant K214A/K250A (g) to liposomes containing 30% PC/40% PE/20% PS and either 10% PI or 5% PI and 5% PIP2. (h) The signals obtained at equilibrium on the 5% PIP2-containing liposomes for PDZ1–PDZ2 tandem in the absence (black continuous line) or in the presence of 2 mM of different 6mer Frizzled 7 peptide as indicated (KGETAV, grey continuous line; AGETAV, black dotted line; EGETAV, grey dotted line) were subtracted for association to 10% PI liposomes and plotted as a function of protein concentration. (a,b,d–h) The data show one experiment representative of at least three independent experiments done in duplicate. RU, response units. See Supplementary Tables 1 and 2 and Supplementary Fig. 4 for complementary information.

